Chromatin Architecture and Selection on X
Thesis Defence: Msc. Project 2024
November 13, 2025
Molecular Biology: Chromosome Architecture
Chromosome Architecture in the Nucleus
- Balance compact storage with functional accessibility for essential processes: replication and gene expression.
Levels of Organization
- Double Helix
- Nucleosomes
- Chromatin
- Fibers
- Loops
- Domains (TADs)
- Compartments
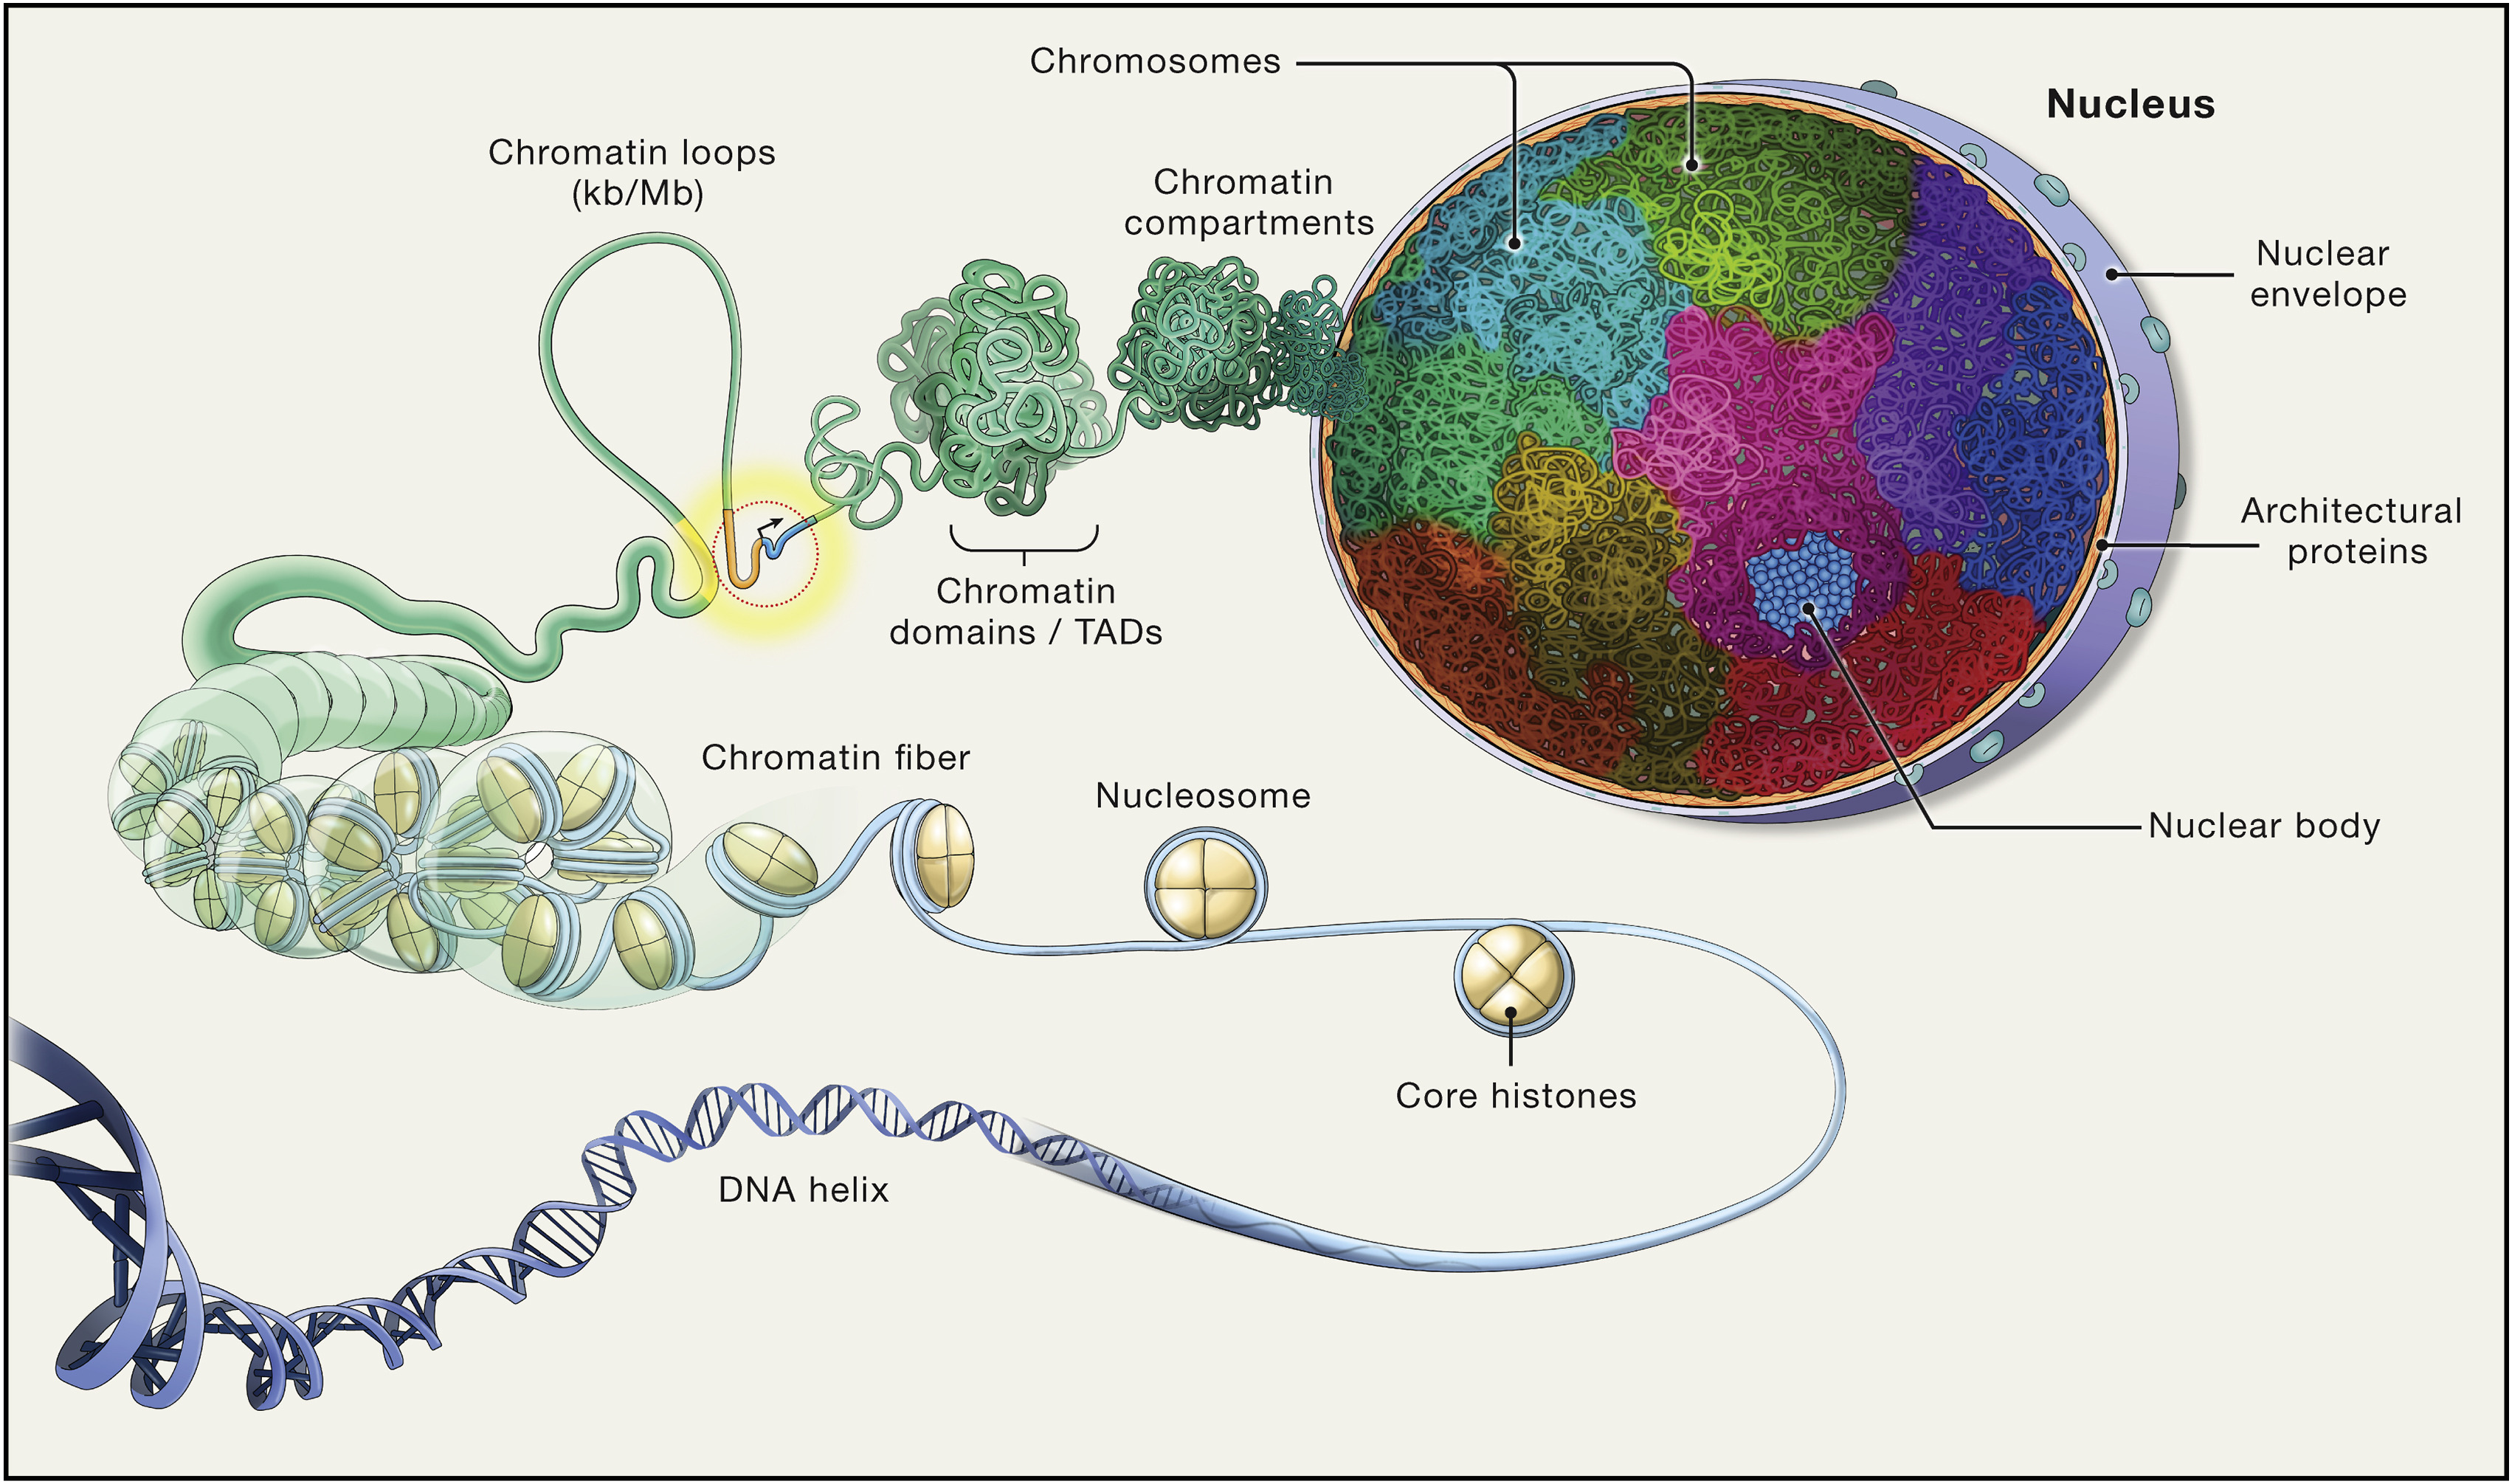
Figure from (Misteli 2020)
Molecular Biology: Chromatin Architecture
Chromosome Architecture in the Nucleus
- Compact storage
- Accessibility
Chromatin
- Fibers
- Loops
- Domains (TADs)
- Compartments
Figure from (Misteli 2020)
Molecular Biology: Compartments
Topologically Associating Domains (TADs)
- Self-interacting chromatin domains that insulate regulatory interactions.
- Act as boundaries to regulate enhancer-promoter interactions.
A/B Compartments
- A-Compartments: Gene-rich, active, euchromatin regions.
- B-Compartments: Gene-poor, inactive, heterochromatin regions.
Key differences
- Method of inference
- Size
Figure from (Misteli 2020)
Hi-C (Chromosome Conformation Capture)
How to capture chromosome conformation:
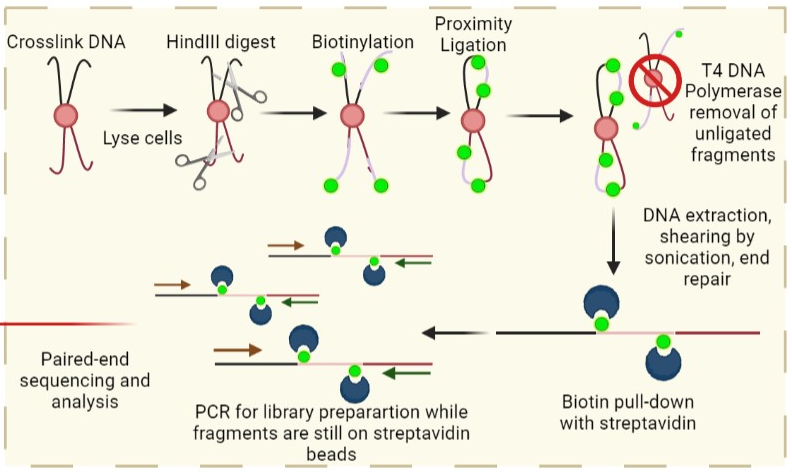
From (WikiCommons:Prakrutiuday)
Hi-C (Chromosome Conformation Capture)
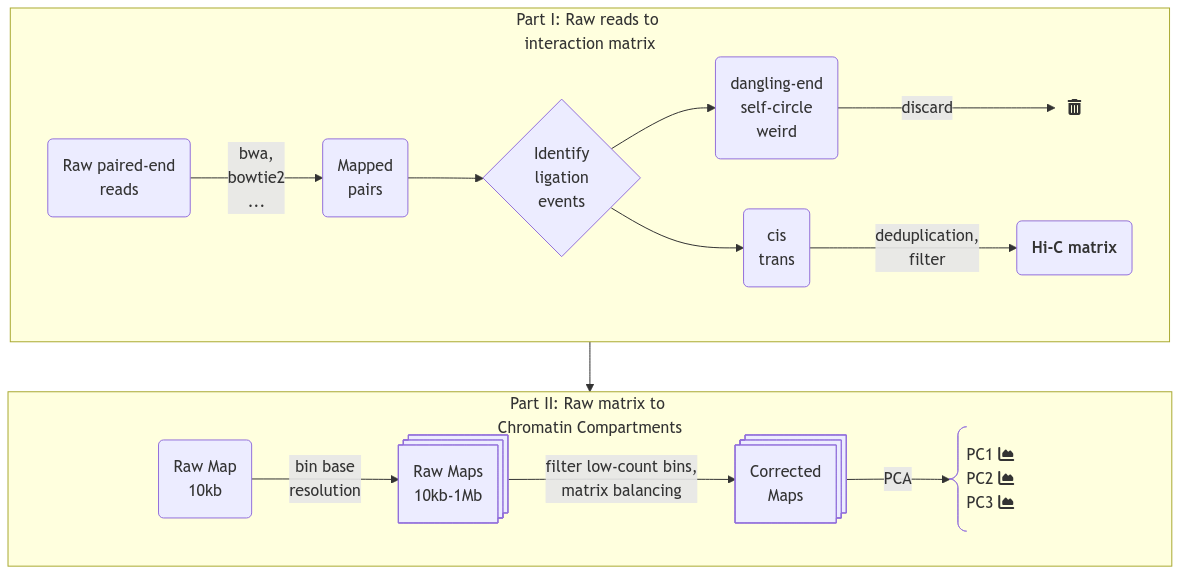
Hi-C (Chromosome Conformation Capture)
Methods
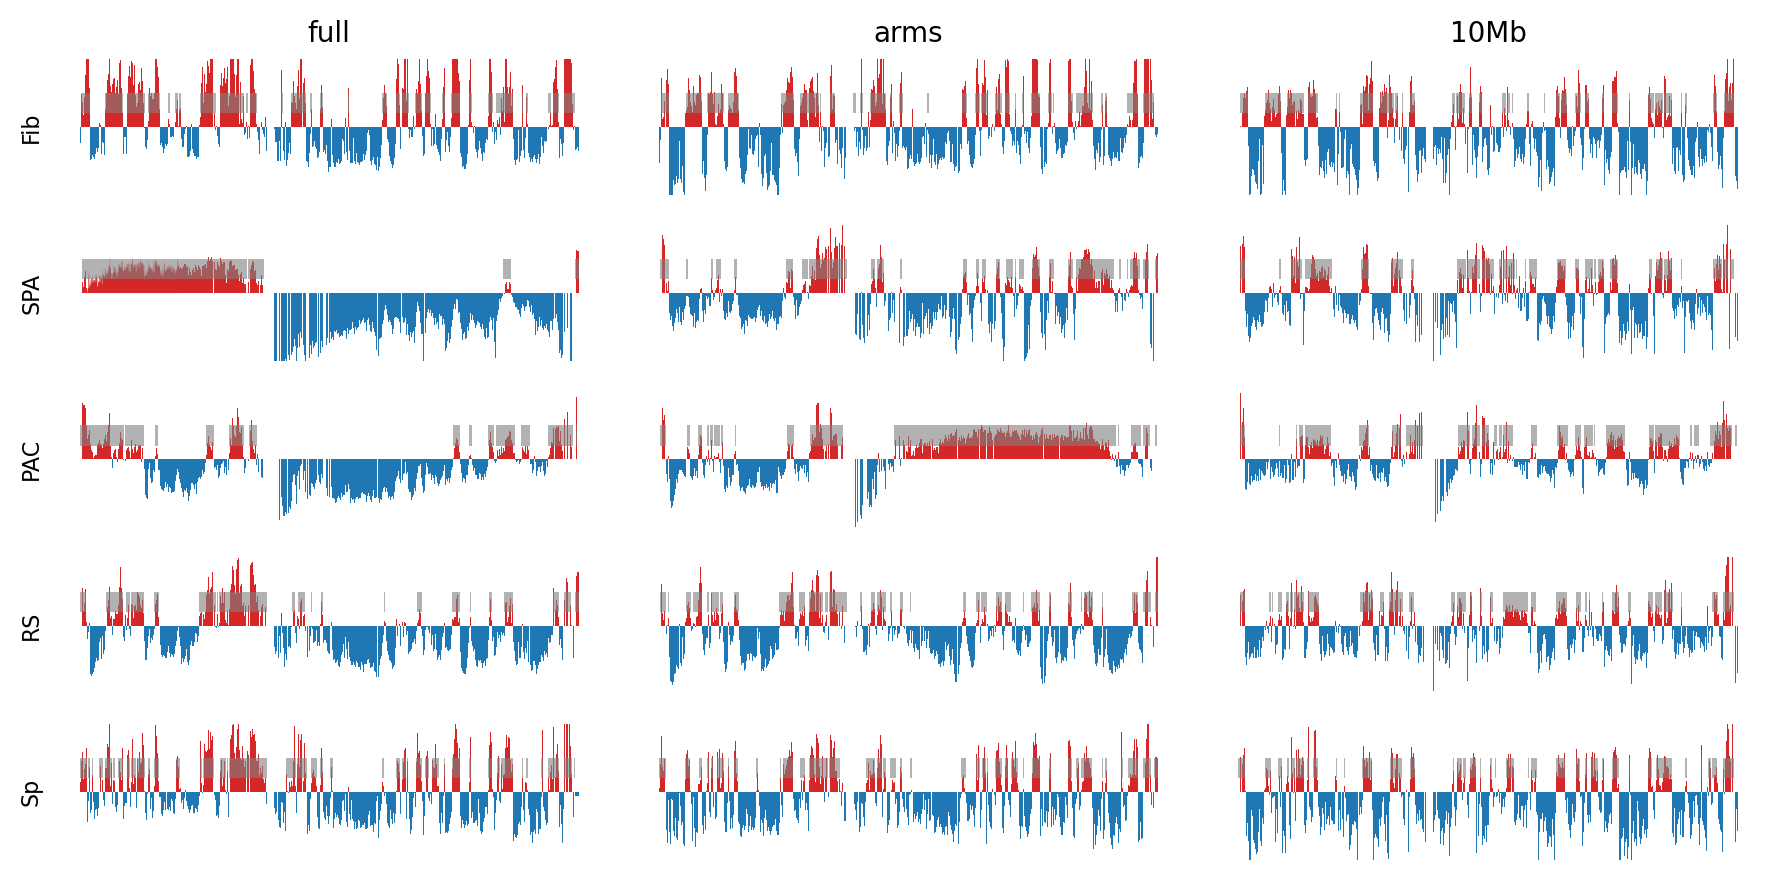
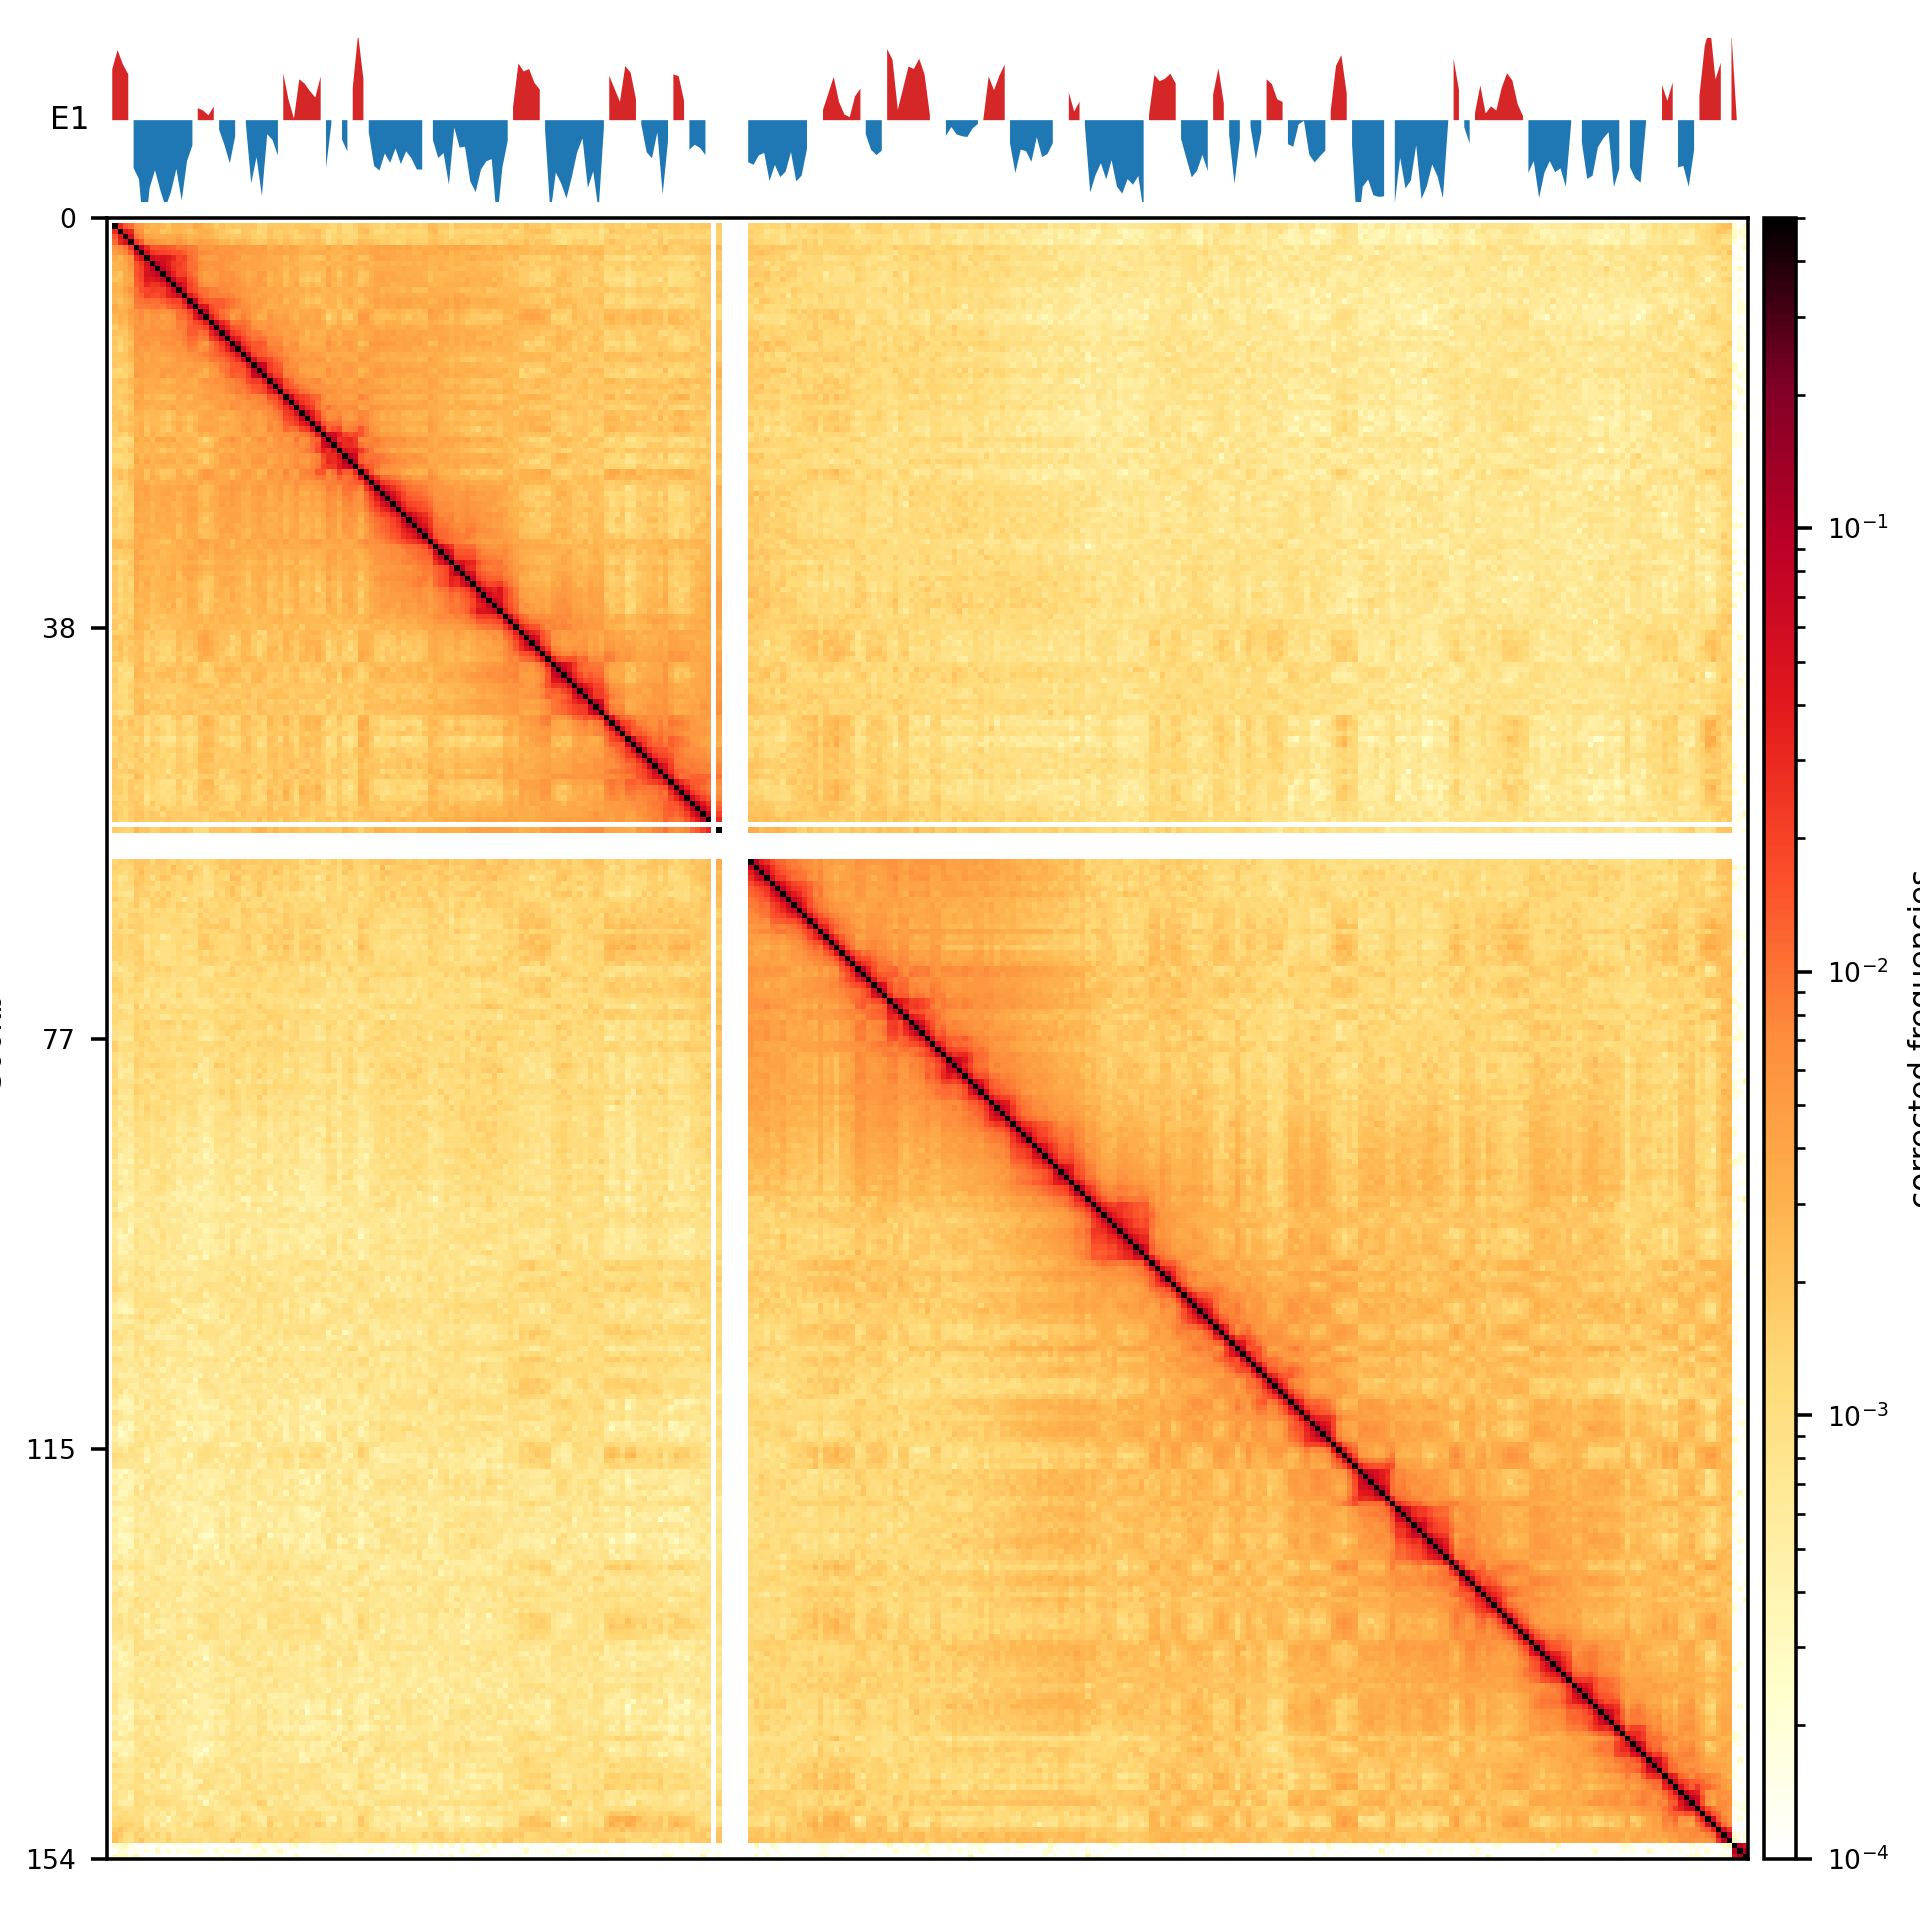
- Infer compartments using HiCExplorer or Open2C
- Try to reproduce the compartments from Wang et al. (2019) in fibroblast
- Success with Open2c:

Genomic Intervals
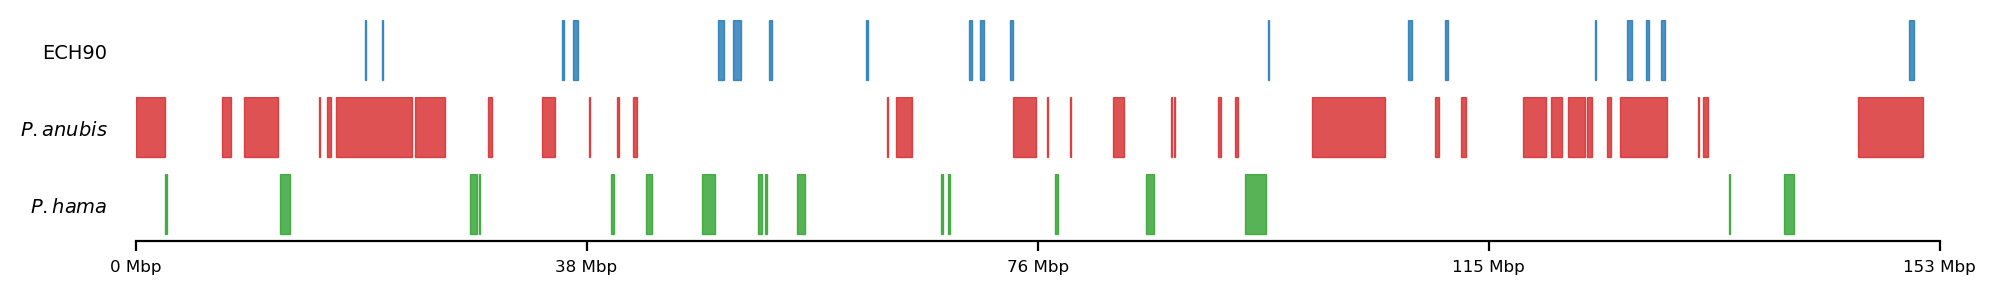
Introducing the regions of selection
- Baboons: Disproportionate parent ancestry on X
- Either olive baboon (P. anubis) or hamadryas (P. hamadryas)
- Human: ECH90 regions
- Extraordinary selective sweeps on X (Extended Common Haplotypes 90% peak). From Skov et al. (2023)
Reproducibility
- Can we reproduce in other organisms?
- The question I have been waiting for
| Tool | Description |
|---|---|
| Jupyter | Interactive coding environment for analysis and development (notebooks are natively rendered with Quarto) |
| Quarto | A Quarto Manuscript project nested inside a Quarto Book for rendering html (website) and PDF (manuscript) from Markdown via Pandoc. Supports direct embedding of output from Jupyter Notebook cells (plots, tables). |
| Conda | For managing software requirements and dependency versions reproducibly. |
| git | Version control and gh-pages branch for automated render of Quarto project |
| GitHub | Action was triggered on push to render the project and host on munch-group.org |
| gwf | Workflow manager to automate the analysis on a HPC cluster, wrapped in Python code. workflow.py currently does everything from .fastq to .cool, but notebooks can be set to run sequentially as part of the workflow as well. |
