import pandas as pdimport numpy as npfrom scipy.stats import chi2import matplotlib.pyplot as pltimport seaborn as snsimport sys, osimport refrom collections import defaultdictimport numpy as npimport pandas as pd%matplotlib inlineimport matplotlib.pyplot as pltfrom matplotlib_inline.backend_inline import set_matplotlib_formatsset_matplotlib_formats('retina', 'png')from matplotlib.patches import Rectangle, Polygonimport seaborn as snssns.set_style('white')import geneinfo as gigi.email('ariadna.saez@alum.esci.upf.edu')%env http_proxy=http://proxy-default:3128def fisher_method_log10(pvalues): df =2*len(pvalues)return-np.log10(1- chi2.cdf(-2*sum(map(np.log, pvalues)), df))def fisher_method(pvalues): df =2*len(pvalues)return1-chi2.cdf(-2*sum(map(np.log, pvalues)), df)
env: http_proxy=http://proxy-default:3128
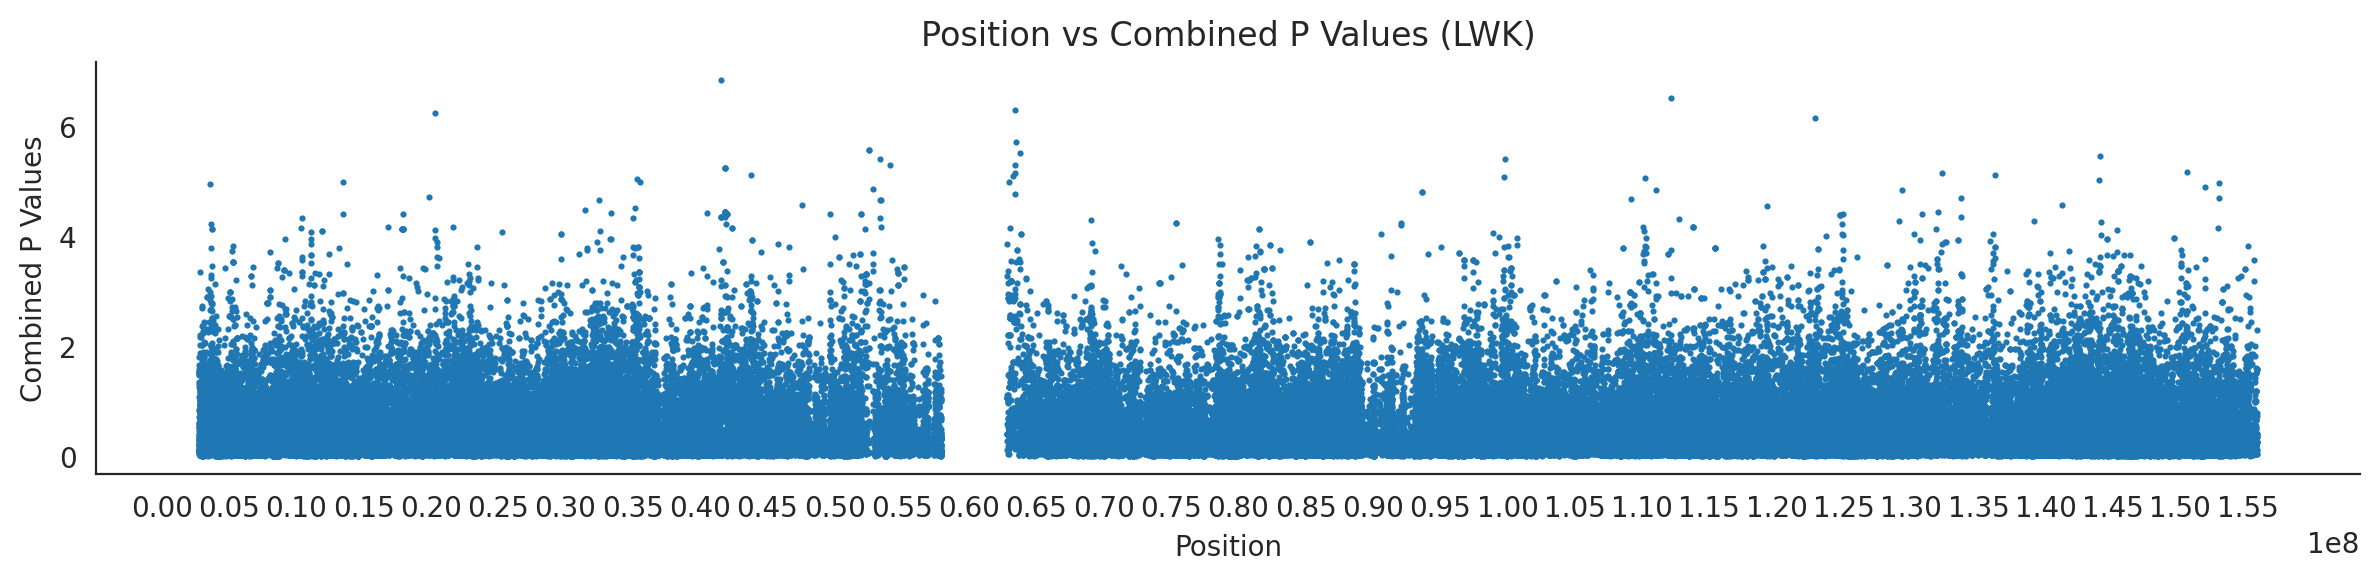
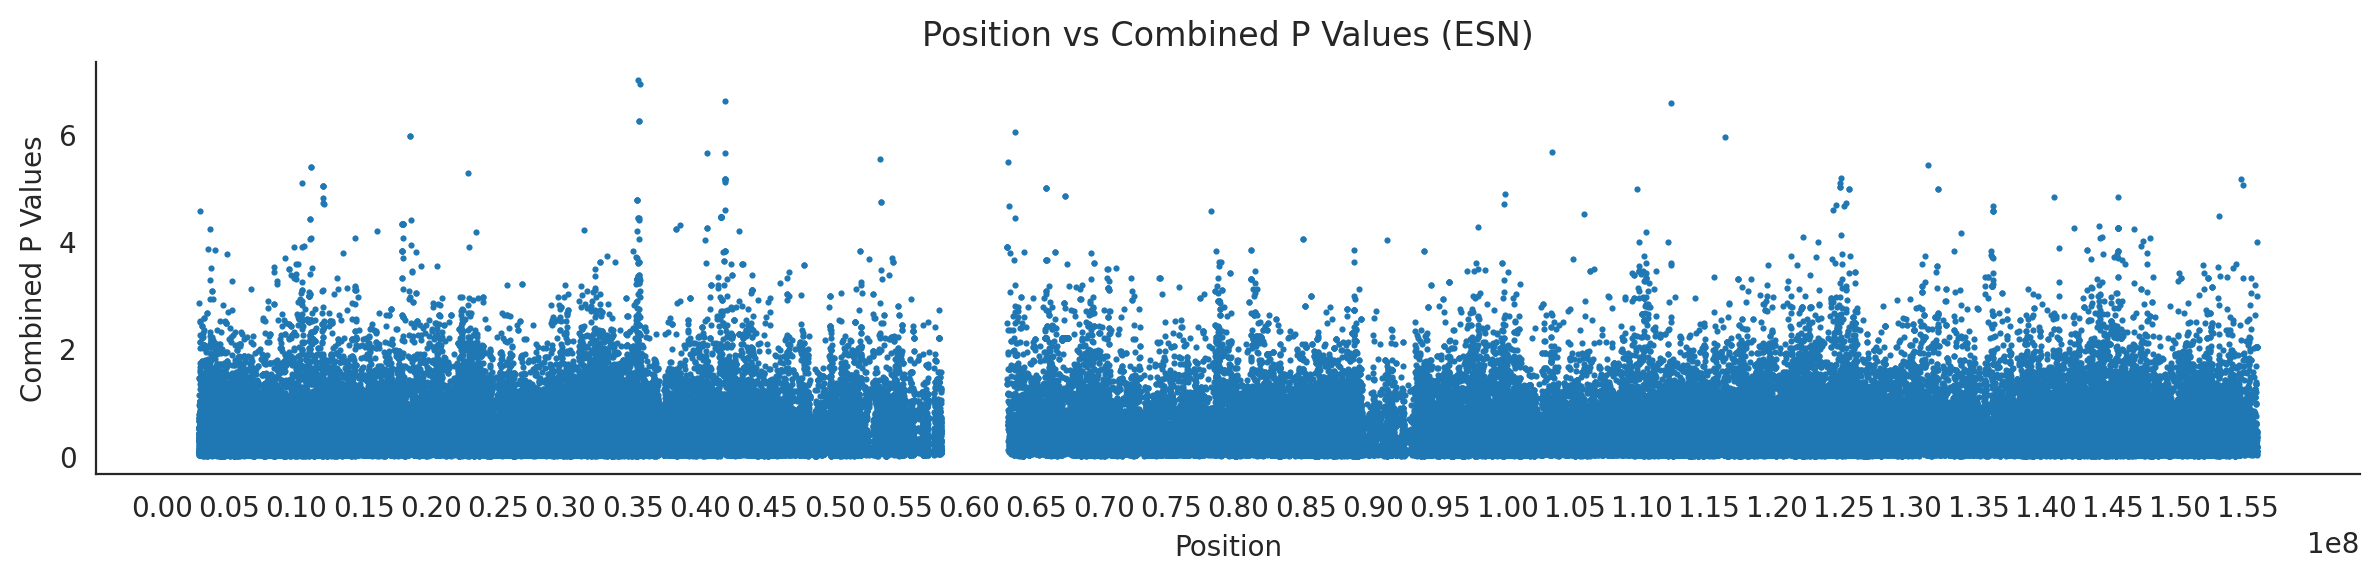
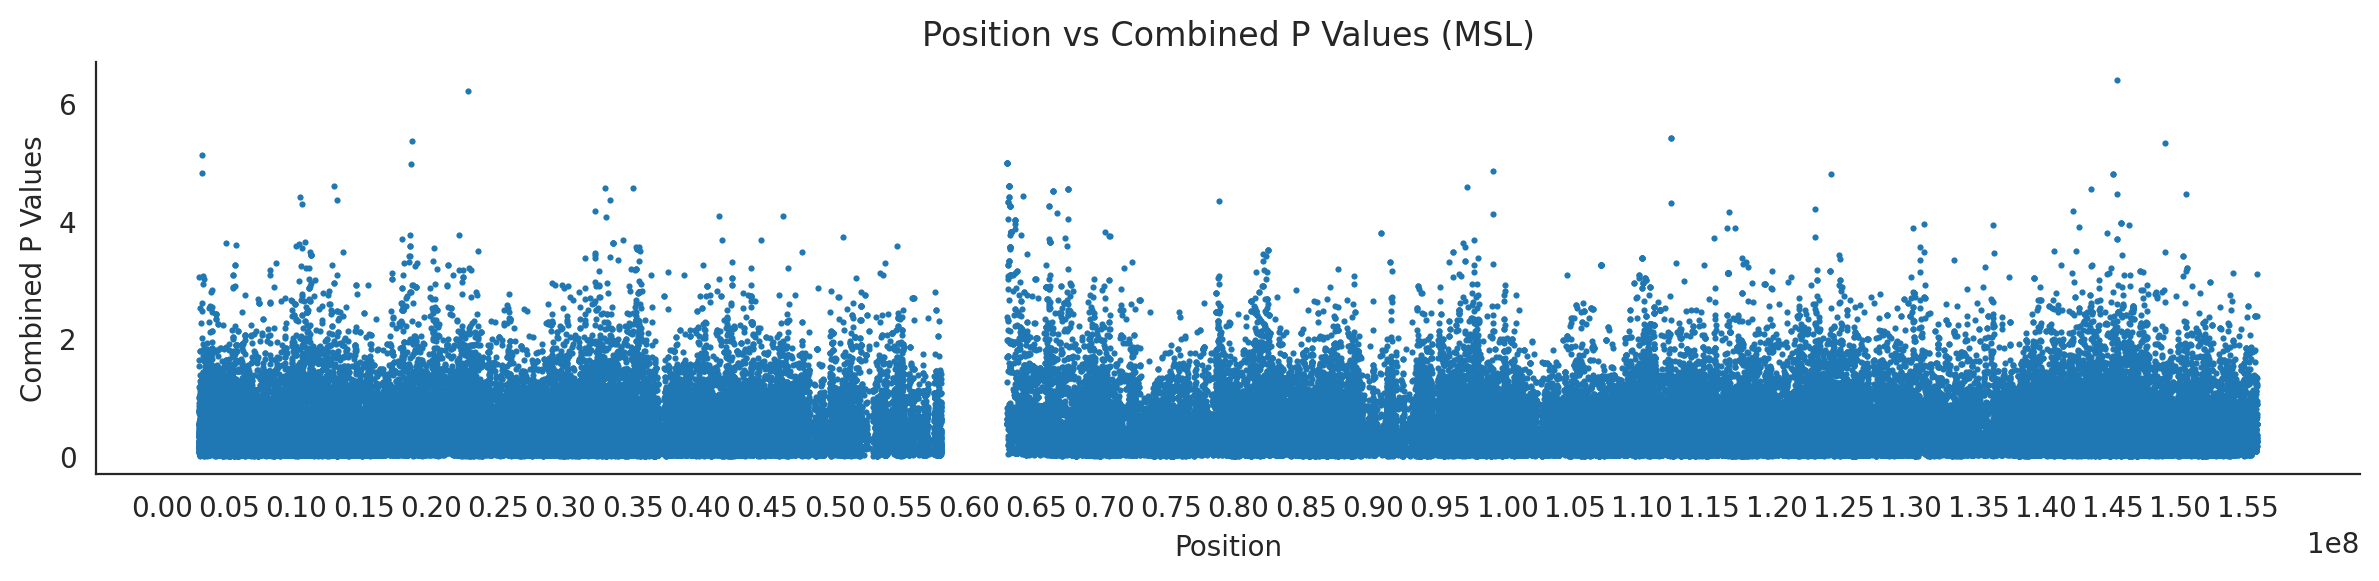
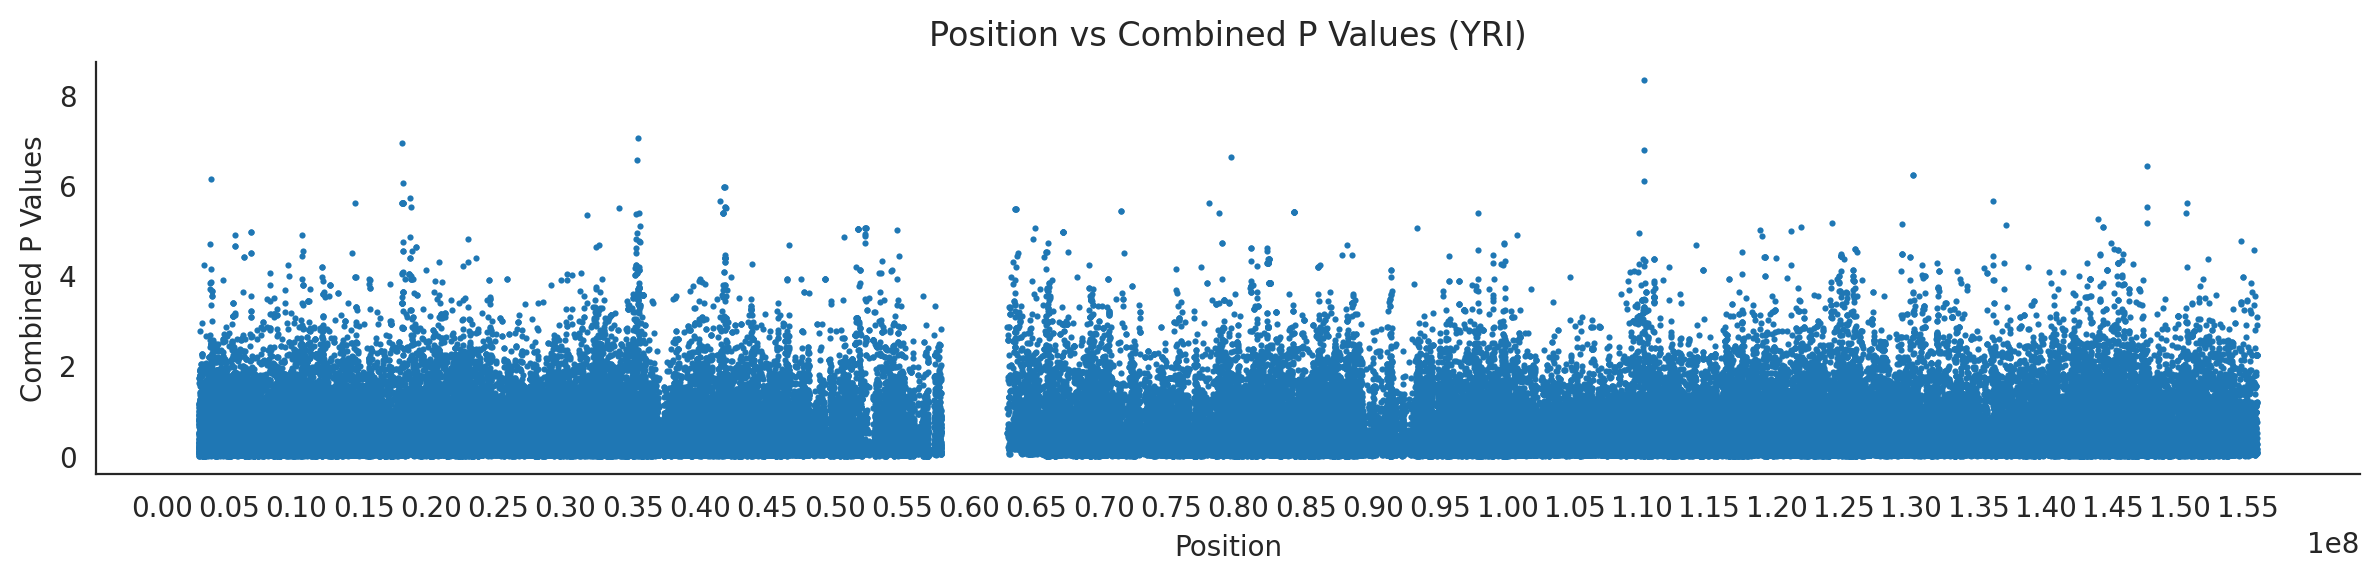
# List of populations and their file pathspopulations = {# africans'LWK': {'relate': "/home/ari/ari-intern/people/ari/ariadna-intern/steps/LWK/relate/run_relate/1000g_ppl_phased_haplotypes_selection.sele",'kasper': "/home/ari/ari-intern/people/ari/ariadna-intern/steps/runs_test/1000g_ppl_phased_haplotypes_LWK_runstats.h5" },'ESN': {'relate': "/home/ari/ari-intern/people/ari/ariadna-intern/steps/ESN/relate/run_relate/1000g_ppl_phased_haplotypes_selection.sele",'kasper': "/home/ari/ari-intern/people/ari/ariadna-intern/steps/runs_test/1000g_ppl_phased_haplotypes_ESN_runstats.h5" },'GWD': {'relate': "/home/ari/ari-intern/people/ari/ariadna-intern/steps/GWD/relate/run_relate/1000g_ppl_phased_haplotypes_selection.sele",'kasper': "/home/ari/ari-intern/people/ari/ariadna-intern/steps/runs_test/1000g_ppl_phased_haplotypes_GWD_runstats.h5" },'MSL': {'relate': "/home/ari/ari-intern/people/ari/ariadna-intern/steps/MSL/relate/run_relate/1000g_ppl_phased_haplotypes_selection.sele",'kasper': "/home/ari/ari-intern/people/ari/ariadna-intern/steps/runs_test/1000g_ppl_phased_haplotypes_MSL_runstats.h5" },'YRI': {'relate': "/home/ari/ari-intern/people/ari/ariadna-intern/steps/YRI/relate/run_relate/1000g_ppl_phased_haplotypes_selection.sele",'kasper': "/home/ari/ari-intern/people/ari/ariadna-intern/steps/runs_test/1000g_ppl_phased_haplotypes_YRI_runstats.h5" }}for population, file_paths in populations.items():# Read files into DataFrames file1 = pd.read_csv(file_paths['relate'], sep=' ') file2 = pd.read_hdf(file_paths['kasper'])# Convert 'pos' column to integers in the second DataFrame (it had decimals - position.0) file2['pos'] = file2['pos'].astype(int)# Merge the two DataFrames on the 'pos' column merged_df = pd.merge(file1[['pos', 'when_mutation_has_freq2']], file2[['pos', 'p']], on='pos', how='inner') merged_df = merged_df.loc[(merged_df.p <1)]# Apply -np.log10() function to the 'p' column (K p-value is not under logarithm)#merged_df['p'] = -np.log10(merged_df['p'])# Change negative values to positive (relate file contains negative values: flip for plotting)# merged_df[['when_mutation_has_freq2', 'p']] = merged_df[['when_mutation_has_freq2', 'p']].abs() merged_df['relate_p'] =10**merged_df.when_mutation_has_freq2 merged_df = merged_df.loc[(merged_df.p <1)]print(f"Merged file for {population}:")print(merged_df) combined_values = merged_df[['when_mutation_has_freq2', 'p']].values.tolist() # list of pairs# Convert data to DataFrame df = pd.DataFrame(merged_df)# Combine p-values combined_p_values = df[['relate_p', 'p']].apply(fisher_method, axis=1) # FISHER METHOD HERE combined_p_values =-np.log10(combined_p_values)# Create a new DataFrame with pos and combined p-values new_df = pd.DataFrame({'pos': df['pos'], 'combined_p_values': combined_p_values})# Specify the file path including the directory and population name file_path = os.path.join("/home/ari/ari-intern/people/ari/ariadna-intern/steps/fisher", f"combined_{population}.csv")# Save the DataFrame with the population name in the filename new_df.to_csv(file_path, index=False)# Plotting plt.figure(figsize=(12, 3)) sns.scatterplot(data=new_df, x='pos', y='combined_p_values', linewidth=0, s=5) plt.xticks(np.arange(0, new_df['pos'].max()+1, 5000000)) plt.xlabel('Position') plt.ylabel('Combined P Values') plt.title(f'Position vs Combined P Values ({population})') plt.tight_layout() sns.despine() plt.show()
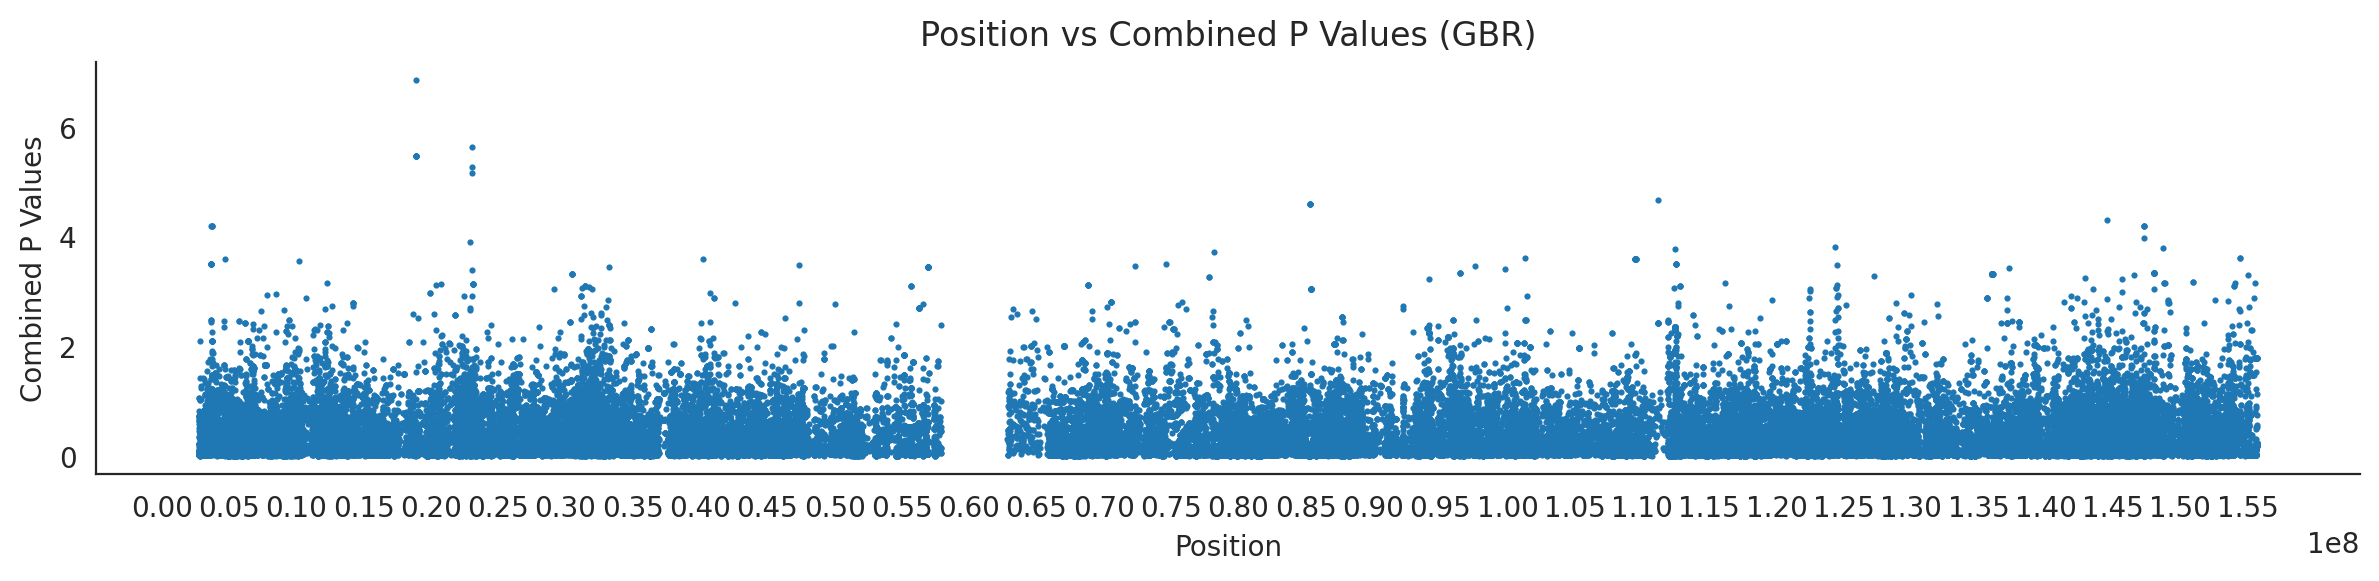
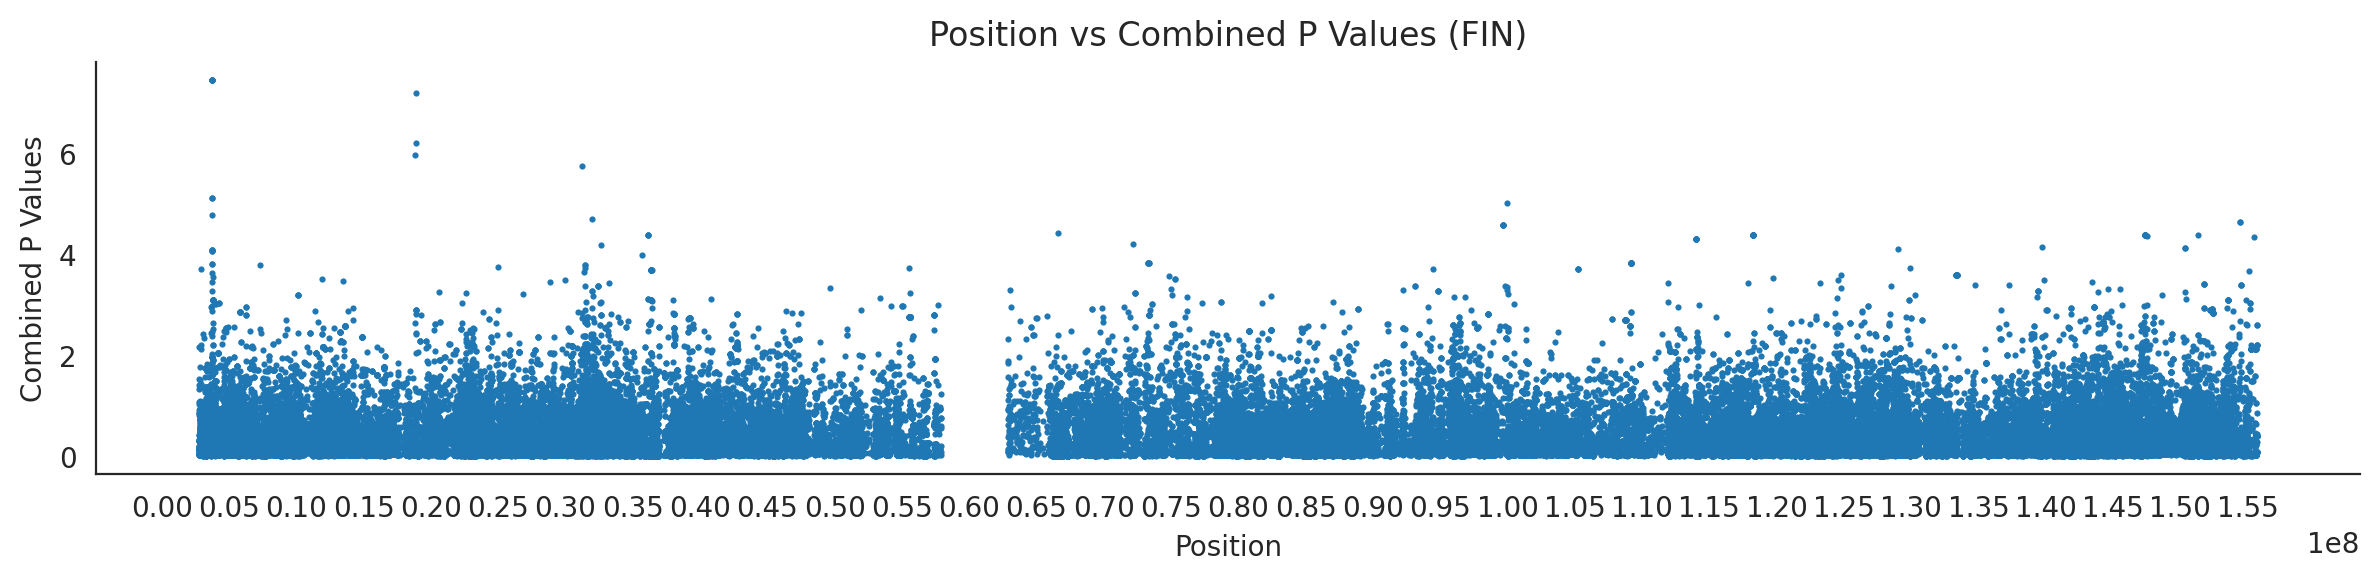
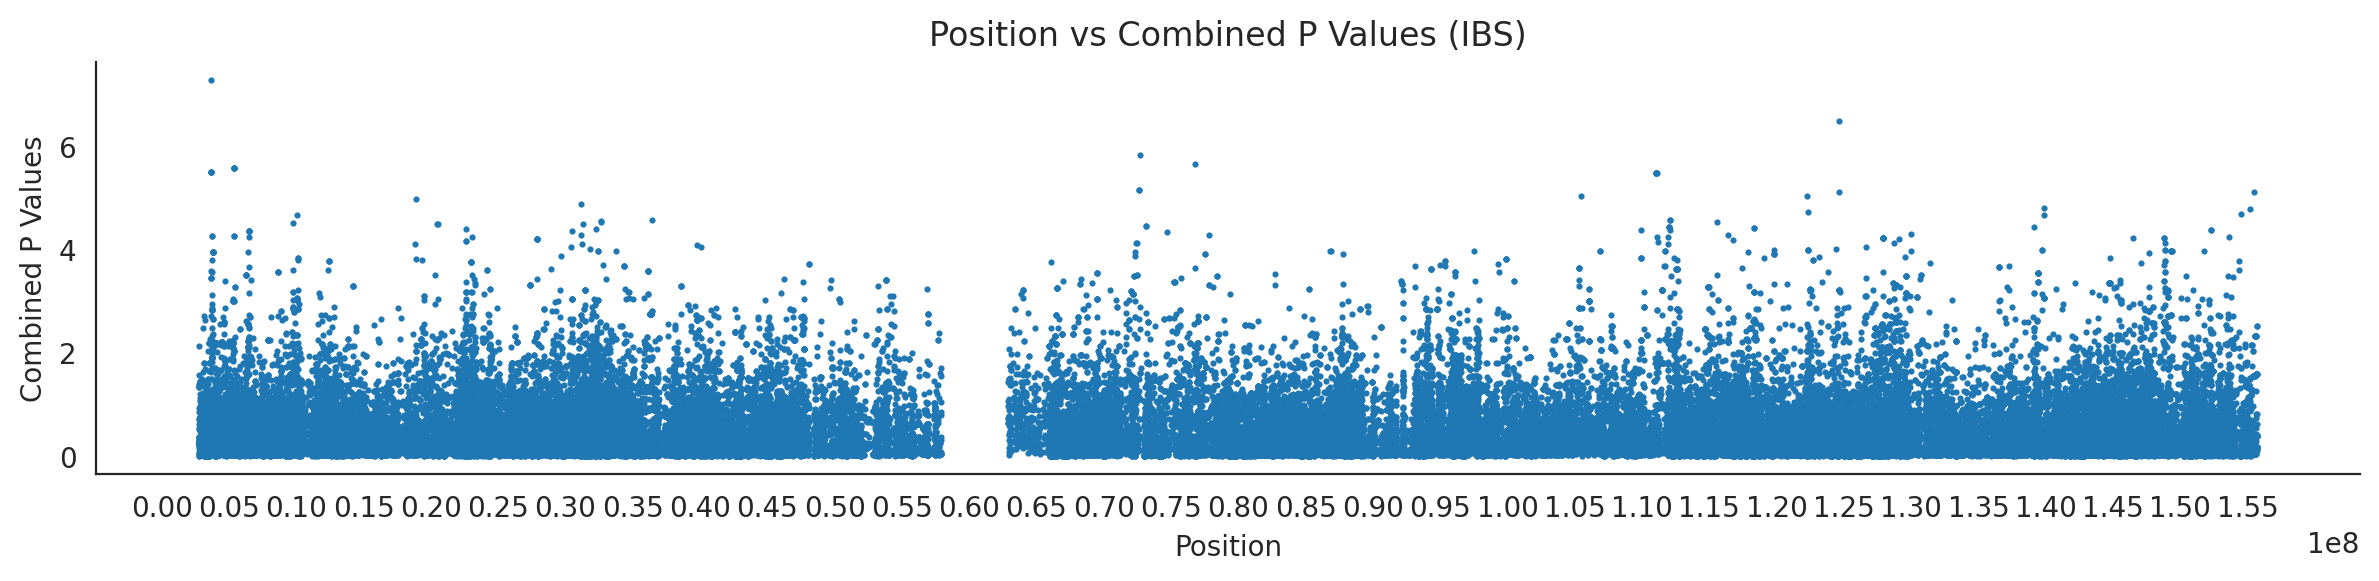
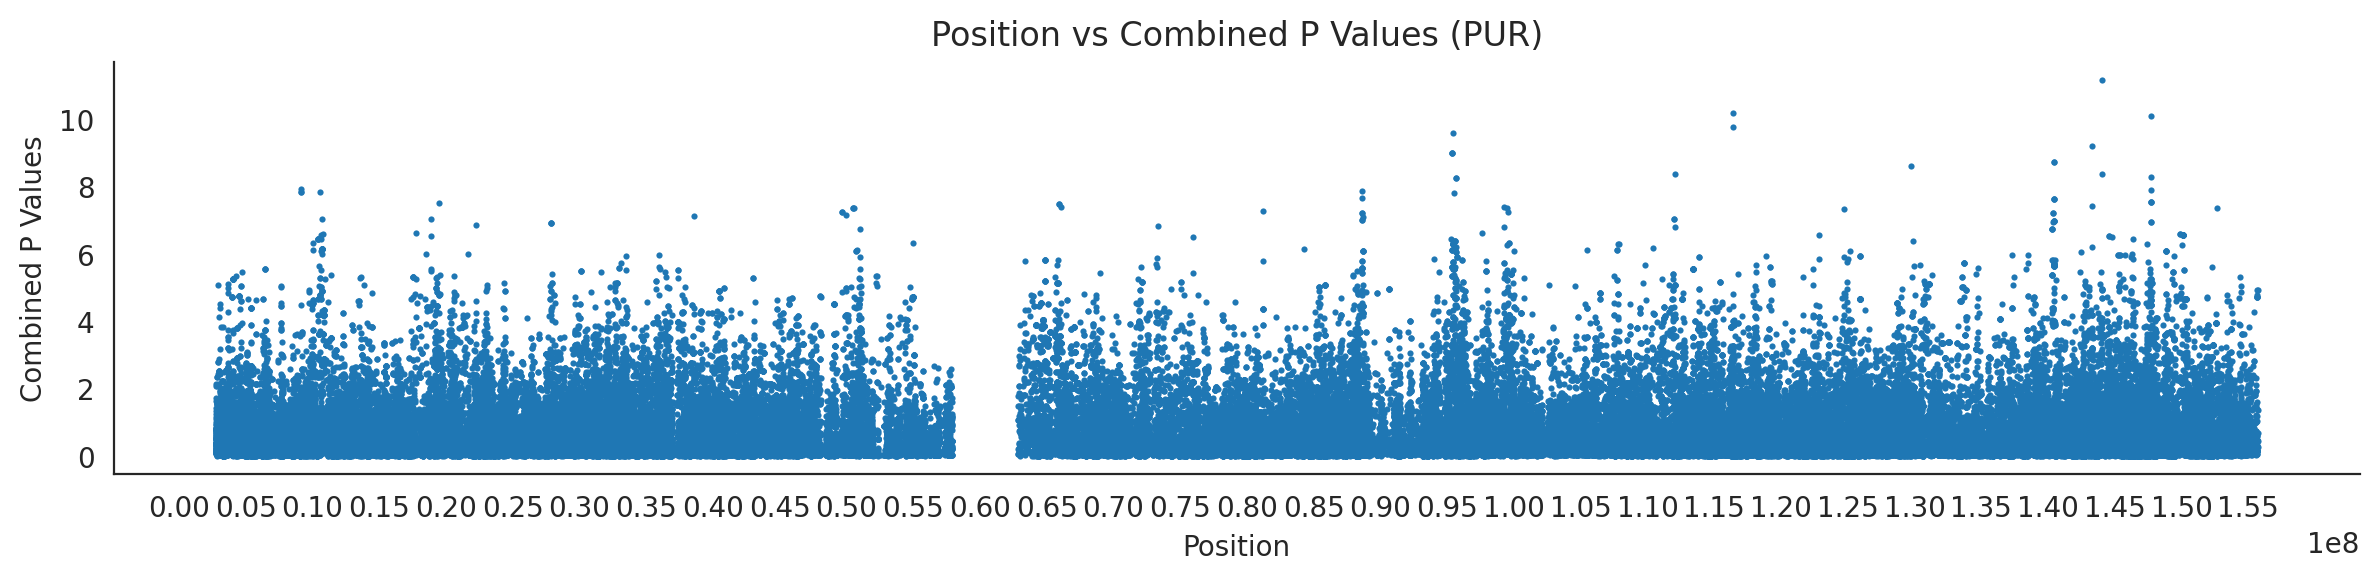
populations = {# europeans'GBR': {'relate': "/home/ari/ari-intern/people/ari/ariadna-intern/steps/GBR/relate/run_relate/1000g_ppl_phased_haplotypes_selection.sele",'kasper': "/home/ari/ari-intern/people/ari/ariadna-intern/steps/runs_test/1000g_ppl_phased_haplotypes_GBR_runstats.h5" },'FIN': {'relate': "/home/ari/ari-intern/people/ari/ariadna-intern/steps/FIN/relate/run_relate/1000g_ppl_phased_haplotypes_selection.sele",'kasper': "/home/ari/ari-intern/people/ari/ariadna-intern/steps/runs_test/1000g_ppl_phased_haplotypes_FIN_runstats.h5" },'IBS': {'relate': "/home/ari/ari-intern/people/ari/ariadna-intern/steps/IBS/relate/run_relate/1000g_ppl_phased_haplotypes_selection.sele",'kasper': "/home/ari/ari-intern/people/ari/ariadna-intern/steps/runs_test/1000g_ppl_phased_haplotypes_IBS_runstats.h5" },'TSI': {'relate': "/home/ari/ari-intern/people/ari/ariadna-intern/steps/TSI/relate/run_relate/1000g_ppl_phased_haplotypes_selection.sele",'kasper': "/home/ari/ari-intern/people/ari/ariadna-intern/steps/runs_test/1000g_ppl_phased_haplotypes_TSI_runstats.h5" },'PUR': {'relate': "/home/ari/ari-intern/people/ari/ariadna-intern/steps/PUR/relate/run_relate/1000g_ppl_phased_haplotypes_selection.sele",'kasper': "/home/ari/ari-intern/people/ari/ariadna-intern/steps/runs_test/1000g_ppl_phased_haplotypes_PUR_runstats.h5" }}for population, file_paths in populations.items():# Read files into DataFrames file1 = pd.read_csv(file_paths['relate'], sep=' ') file2 = pd.read_hdf(file_paths['kasper'])# Convert 'pos' column to integers in the second DataFrame (it had decimals - position.0) file2['pos'] = file2['pos'].astype(int)# Merge the two DataFrames on the 'pos' column merged_df = pd.merge(file1[['pos', 'when_mutation_has_freq2']], file2[['pos', 'p']], on='pos', how='inner') merged_df = merged_df.loc[(merged_df.p <1)]# Apply -np.log10() function to the 'p' column (K p-value is not under logarithm)#merged_df['p'] = -np.log10(merged_df['p'])# Change negative values to positive (relate file contains negative values: flip for plotting)# merged_df[['when_mutation_has_freq2', 'p']] = merged_df[['when_mutation_has_freq2', 'p']].abs() merged_df['relate_p'] =10**merged_df.when_mutation_has_freq2 merged_df = merged_df.loc[(merged_df.p <1)]print(f"Merged file for {population}:")print(merged_df) combined_values = merged_df[['when_mutation_has_freq2', 'p']].values.tolist() # list of pairs# Convert data to DataFrame df = pd.DataFrame(merged_df)# Combine p-values combined_p_values = df[['relate_p', 'p']].apply(fisher_method, axis=1) combined_p_values =-np.log10(combined_p_values)# Create a new DataFrame with pos and combined p-values new_df = pd.DataFrame({'pos': df['pos'], 'combined_p_values': combined_p_values})# Specify the file path including the directory and population name file_path = os.path.join("/home/ari/ari-intern/people/ari/ariadna-intern/steps/fisher", f"combined_{population}.csv")# Save the DataFrame with the population name in the filename new_df.to_csv(file_path, index=False)# Plotting plt.figure(figsize=(12, 3)) sns.scatterplot(data=new_df, x='pos', y='combined_p_values', linewidth=0, s=5) plt.xticks(np.arange(0, new_df['pos'].max()+1, 5000000)) plt.xlabel('Position') plt.ylabel('Combined P Values') plt.title(f'Position vs Combined P Values ({population})') plt.tight_layout() sns.despine() plt.show()
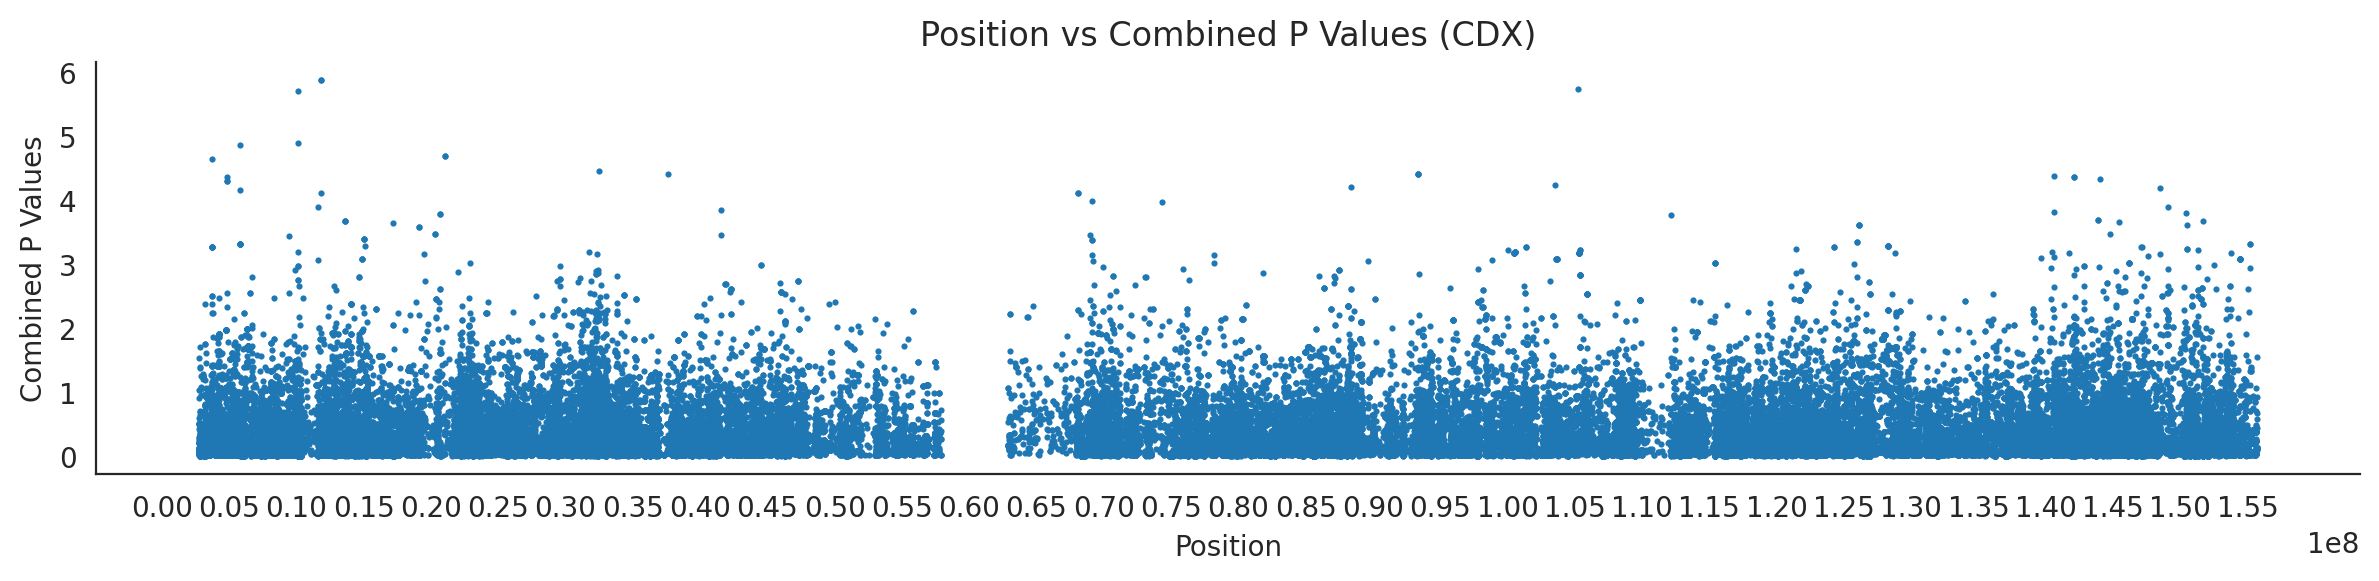
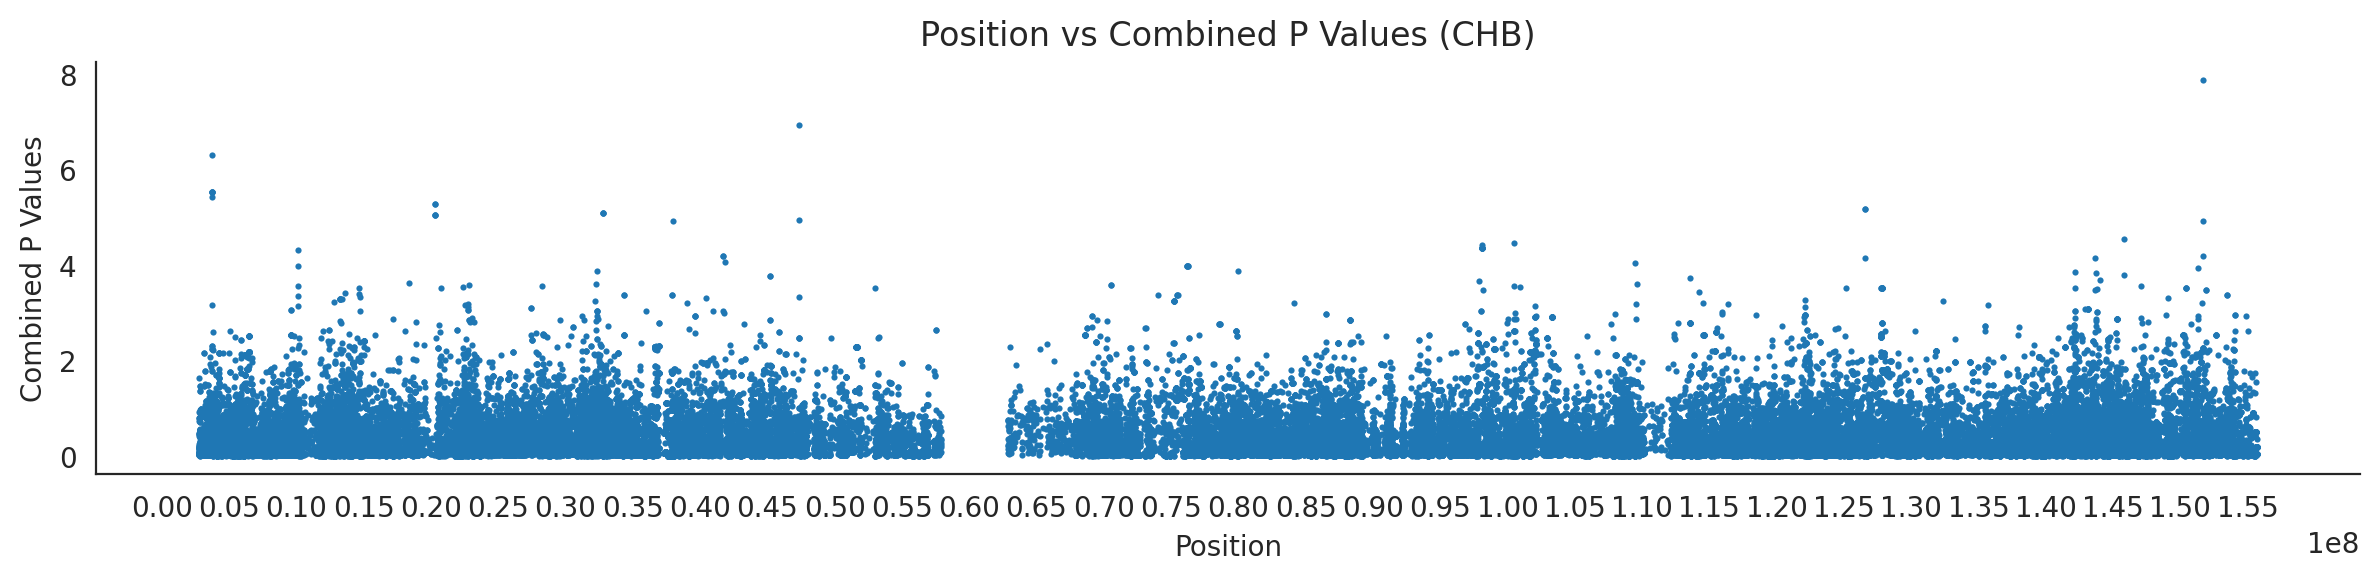
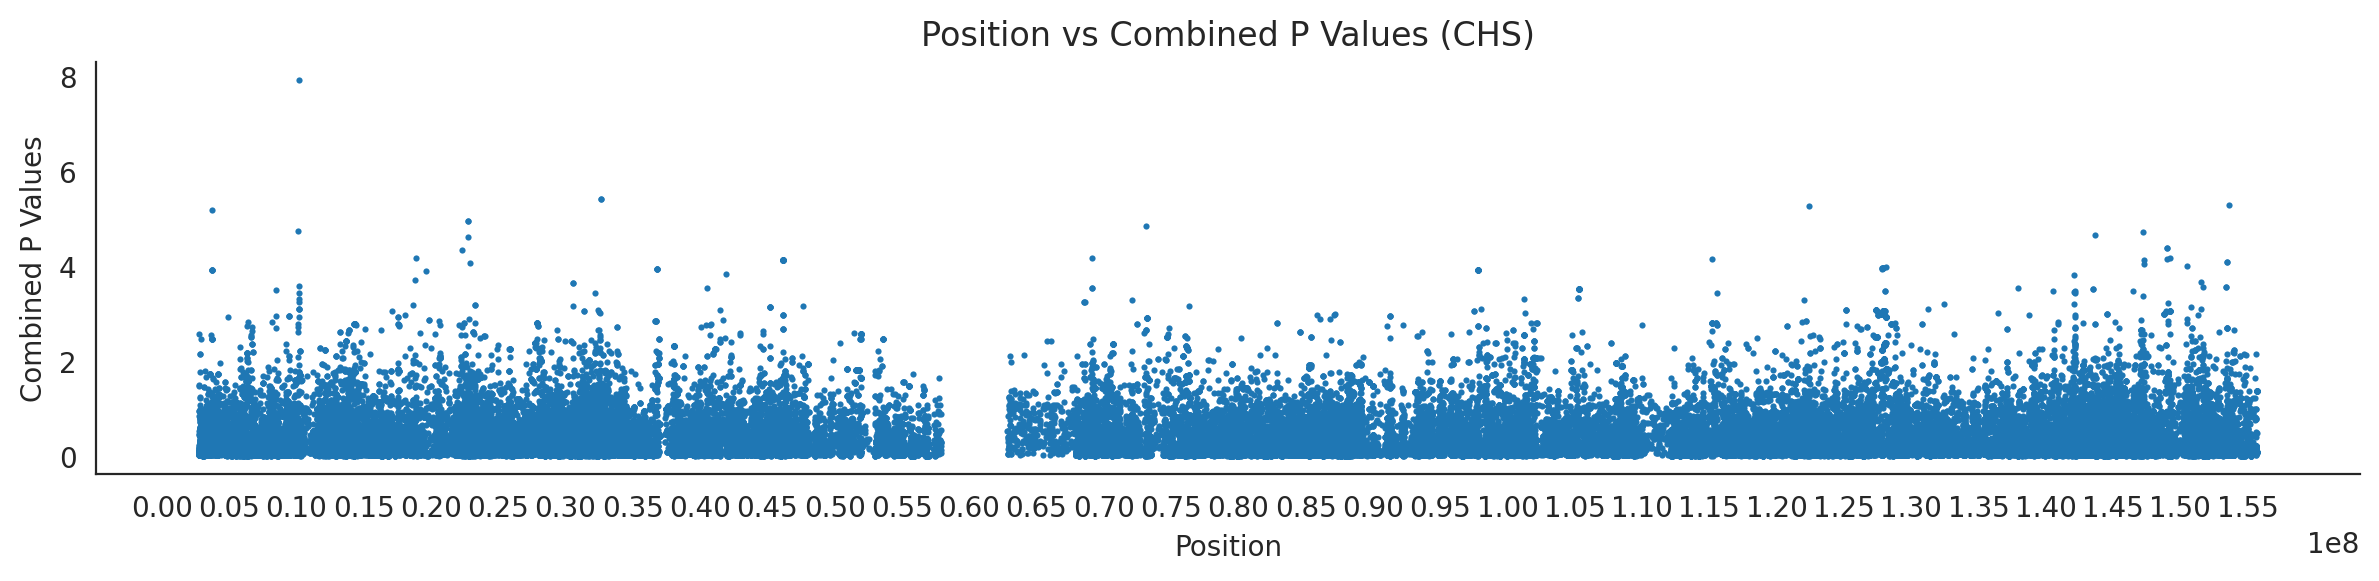
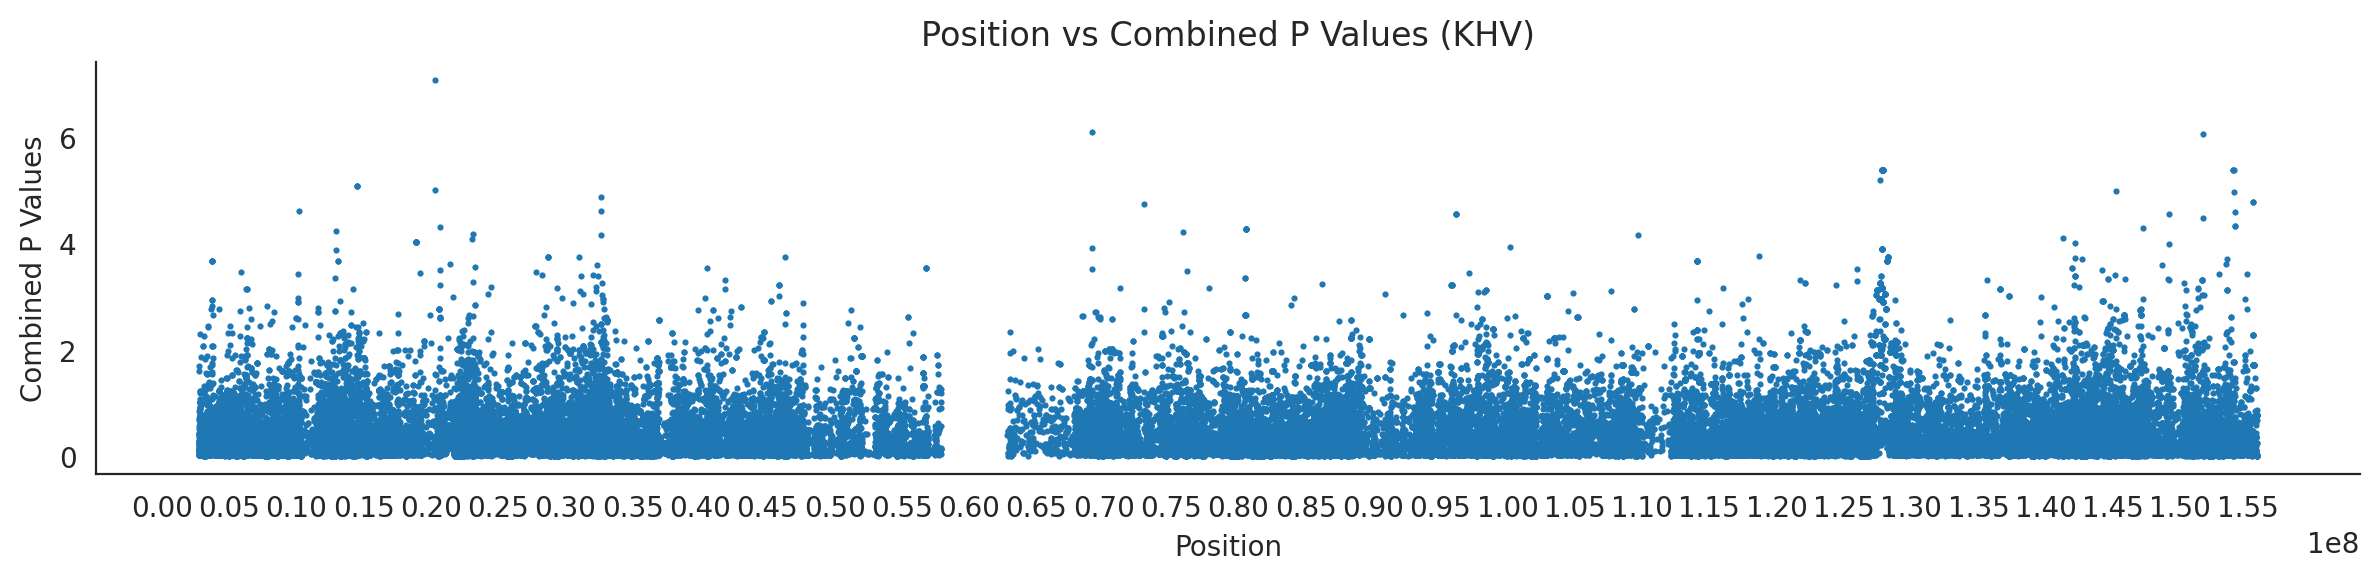
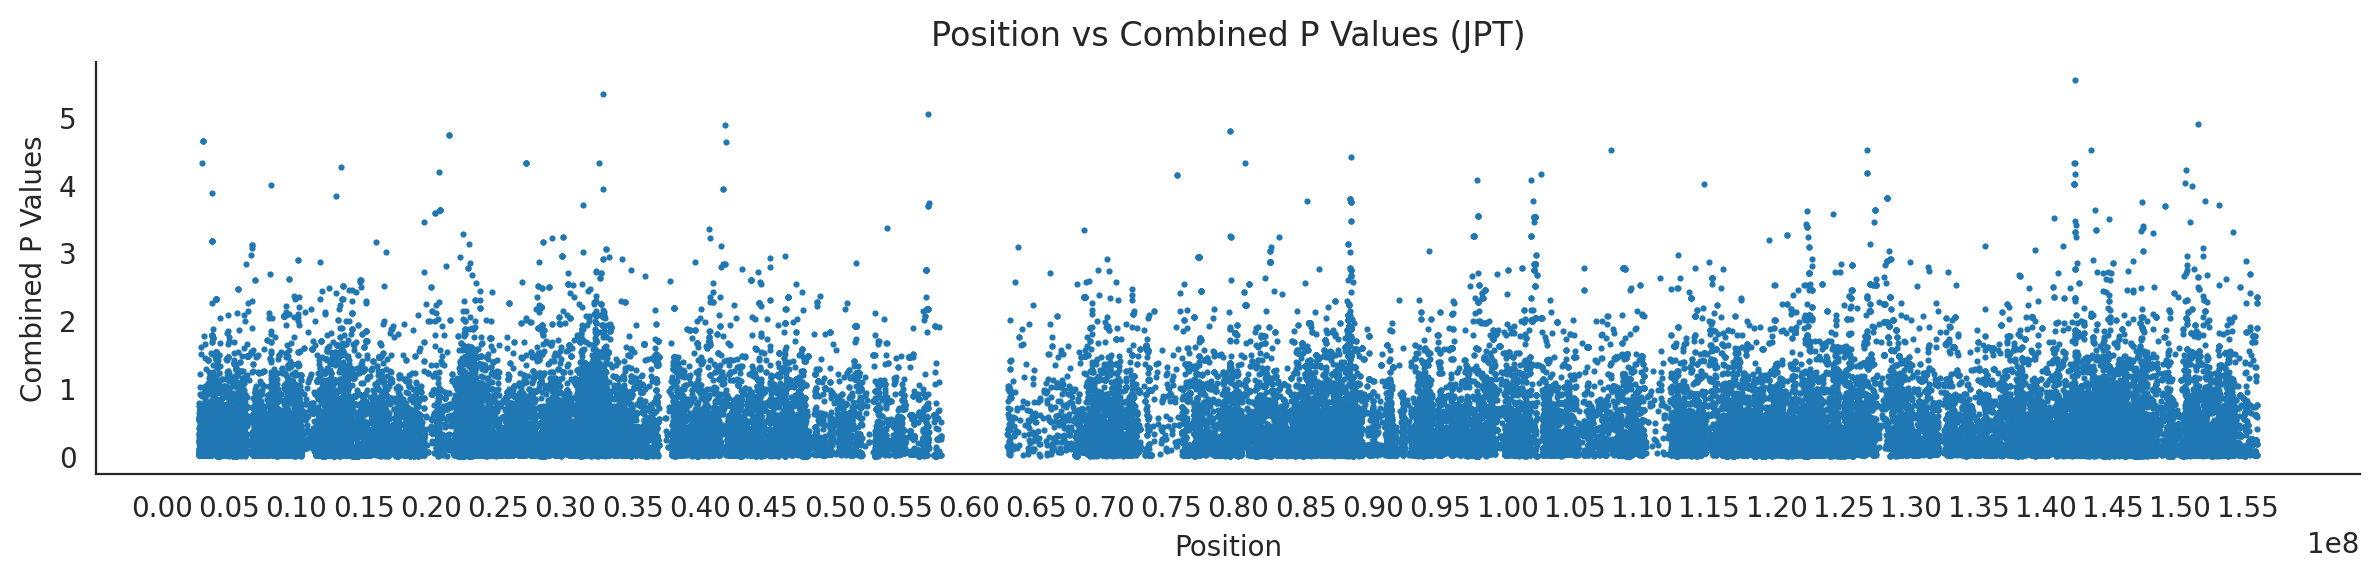
populations = {# asians'CDX': {'relate': "/home/ari/ari-intern/people/ari/ariadna-intern/steps/CDX/relate/run_relate/1000g_ppl_phased_haplotypes_selection.sele",'kasper': "/home/ari/ari-intern/people/ari/ariadna-intern/steps/runs_test/1000g_ppl_phased_haplotypes_CDX_runstats.h5" },'CHB': {'relate': "/home/ari/ari-intern/people/ari/ariadna-intern/steps/CHB/relate/run_relate/1000g_ppl_phased_haplotypes_selection.sele",'kasper': "/home/ari/ari-intern/people/ari/ariadna-intern/steps/runs_test/1000g_ppl_phased_haplotypes_CHB_runstats.h5" },'CHS': {'relate': "/home/ari/ari-intern/people/ari/ariadna-intern/steps/CHS/relate/run_relate/1000g_ppl_phased_haplotypes_selection.sele",'kasper': "/home/ari/ari-intern/people/ari/ariadna-intern/steps/runs_test/1000g_ppl_phased_haplotypes_CHS_runstats.h5" },'KHV': {'relate': "/home/ari/ari-intern/people/ari/ariadna-intern/steps/KHV/relate/run_relate/1000g_ppl_phased_haplotypes_selection.sele",'kasper': "/home/ari/ari-intern/people/ari/ariadna-intern/steps/runs_test/1000g_ppl_phased_haplotypes_KHV_runstats.h5" },'JPT': {'relate': "/home/ari/ari-intern/people/ari/ariadna-intern/steps/JPT/relate/run_relate/1000g_ppl_phased_haplotypes_selection.sele",'kasper': "/home/ari/ari-intern/people/ari/ariadna-intern/steps/runs_test/1000g_ppl_phased_haplotypes_JPT_runstats.h5" }}for population, file_paths in populations.items():# Read files into DataFrames file1 = pd.read_csv(file_paths['relate'], sep=' ') file2 = pd.read_hdf(file_paths['kasper'])# Convert 'pos' column to integers in the second DataFrame (it had decimals - position.0) file2['pos'] = file2['pos'].astype(int)# Merge the two DataFrames on the 'pos' column merged_df = pd.merge(file1[['pos', 'when_mutation_has_freq2']], file2[['pos', 'p']], on='pos', how='inner') merged_df = merged_df.loc[(merged_df.p <1)]# Apply -np.log10() function to the 'p' column (K p-value is not under logarithm)#merged_df['p'] = -np.log10(merged_df['p'])# Change negative values to positive (relate file contains negative values: flip for plotting)# merged_df[['when_mutation_has_freq2', 'p']] = merged_df[['when_mutation_has_freq2', 'p']].abs() merged_df['relate_p'] =10**merged_df.when_mutation_has_freq2 merged_df = merged_df.loc[(merged_df.p <1)]print(f"Merged file for {population}:")print(merged_df) combined_values = merged_df[['when_mutation_has_freq2', 'p']].values.tolist() # list of pairs# Convert data to DataFrame df = pd.DataFrame(merged_df)# Combine p-values combined_p_values = df[['relate_p', 'p']].apply(fisher_method, axis=1) combined_p_values =-np.log10(combined_p_values)# Create a new DataFrame with pos and combined p-values new_df = pd.DataFrame({'pos': df['pos'], 'combined_p_values': combined_p_values})# Specify the file path including the directory and population name file_path = os.path.join("/home/ari/ari-intern/people/ari/ariadna-intern/steps/fisher", f"combined_{population}.csv")# Save the DataFrame with the population name in the filename new_df.to_csv(file_path, index=False)# Plotting plt.figure(figsize=(12, 3)) sns.scatterplot(data=new_df, x='pos', y='combined_p_values', linewidth=0, s=5) plt.xticks(np.arange(0, new_df['pos'].max()+1, 5000000)) plt.xlabel('Position') plt.ylabel('Combined P Values') plt.title(f'Position vs Combined P Values ({population})') plt.tight_layout() sns.despine() plt.show()