import arviz as az
import cloudpickle as cp

name = "N_N_HN"

trace = az.from_netcdf(f"../results/traces/{name}_trace.nc")

with open(f"../results/models/{name}_model.pkl", "rb") as f:
model = cp.load(f)Reintroducing latent z in GRW
Reintroducing the latent z assignment in the GRW model
Goals
Here, we re-introduce the latent binwise assignment of compartments A or B from the eigenvector track.
First, we will try to do a simple post-hoc simulation of the \(\hat{y}\) values estimated from the previous notebook. There, no latent state was assigned each bin, but only a mixture weight, \(w\), of the two compartment distribitutions.
tracearviz.InferenceData
-
<xarray.Dataset> Size: 242MB Dimensions: (chain: 7, draw: 1000, pos: 1438, mu_dim_0: 2, sigma_dim_0: 2) Coordinates: * chain (chain) int64 56B 0 1 2 3 4 5 6 * draw (draw) int64 8kB 0 1 2 3 4 5 6 ... 993 994 995 996 997 998 999 * pos (pos) int64 12kB 24 25 26 27 28 29 ... 1615 1618 1619 1620 1621 * mu_dim_0 (mu_dim_0) int64 16B 0 1 * sigma_dim_0 (sigma_dim_0) int64 16B 0 1 Data variables: eps (chain, draw, pos) float64 81MB ... mu (chain, draw, mu_dim_0) float64 112kB ... sigma (chain, draw, sigma_dim_0) float64 112kB ... grw_sigma (chain, draw) float64 56kB ... logit_w (chain, draw, pos) float64 81MB ... w (chain, draw, pos) float64 81MB ... Attributes: created_at: 2025-07-17T20:42:05.061371+00:00 arviz_version: 0.21.0 inference_library: pymc inference_library_version: 5.22.0 sampling_time: 302.33364176750183 tuning_steps: 1000 -
<xarray.Dataset> Size: 81MB Dimensions: (chain: 7, draw: 1000, pos: 1438) Coordinates: * chain (chain) int64 56B 0 1 2 3 4 5 6 * draw (draw) int64 8kB 0 1 2 3 4 5 6 7 ... 993 994 995 996 997 998 999 * pos (pos) int64 12kB 24 25 26 27 28 29 ... 1615 1618 1619 1620 1621 Data variables: y_hat (chain, draw, pos) float64 81MB ... Attributes: created_at: 2025-07-17T22:04:45.542489+00:00 arviz_version: 0.21.0 inference_library: pymc inference_library_version: 5.22.0 -
<xarray.Dataset> Size: 81MB Dimensions: (chain: 7, draw: 1000, pos: 1438) Coordinates: * chain (chain) int64 56B 0 1 2 3 4 5 6 * draw (draw) int64 8kB 0 1 2 3 4 5 6 7 ... 993 994 995 996 997 998 999 * pos (pos) int64 12kB 24 25 26 27 28 29 ... 1615 1618 1619 1620 1621 Data variables: y_hat (chain, draw, pos) float64 81MB ... Attributes: created_at: 2025-07-17T22:04:05.221796+00:00 arviz_version: 0.21.0 inference_library: pymc inference_library_version: 5.22.0 -
<xarray.Dataset> Size: 862kB Dimensions: (chain: 7, draw: 1000) Coordinates: * chain (chain) int64 56B 0 1 2 3 4 5 6 * draw (draw) int64 8kB 0 1 2 3 4 5 ... 995 996 997 998 999 Data variables: (12/17) tree_depth (chain, draw) int64 56kB ... largest_eigval (chain, draw) float64 56kB ... step_size_bar (chain, draw) float64 56kB ... process_time_diff (chain, draw) float64 56kB ... diverging (chain, draw) bool 7kB ... step_size (chain, draw) float64 56kB ... ... ... acceptance_rate (chain, draw) float64 56kB ... index_in_trajectory (chain, draw) int64 56kB ... perf_counter_start (chain, draw) float64 56kB ... max_energy_error (chain, draw) float64 56kB ... lp (chain, draw) float64 56kB ... perf_counter_diff (chain, draw) float64 56kB ... Attributes: created_at: 2025-07-17T20:42:05.081859+00:00 arviz_version: 0.21.0 inference_library: pymc inference_library_version: 5.22.0 sampling_time: 302.33364176750183 tuning_steps: 1000 -
<xarray.Dataset> Size: 35MB Dimensions: (chain: 1, draw: 1000, pos: 1438, sigma_dim_0: 2, mu_dim_0: 2) Coordinates: * chain (chain) int64 8B 0 * draw (draw) int64 8kB 0 1 2 3 4 5 6 ... 993 994 995 996 997 998 999 * pos (pos) int64 12kB 24 25 26 27 28 29 ... 1615 1618 1619 1620 1621 * sigma_dim_0 (sigma_dim_0) int64 16B 0 1 * mu_dim_0 (mu_dim_0) int64 16B 0 1 Data variables: grw_sigma (chain, draw) float64 8kB ... w (chain, draw, pos) float64 12MB ... sigma (chain, draw, sigma_dim_0) float64 16kB ... eps (chain, draw, pos) float64 12MB ... logit_w (chain, draw, pos) float64 12MB ... mu (chain, draw, mu_dim_0) float64 16kB ... Attributes: created_at: 2025-07-17T22:04:10.448419+00:00 arviz_version: 0.21.0 inference_library: pymc inference_library_version: 5.22.0 -
<xarray.Dataset> Size: 12MB Dimensions: (chain: 1, draw: 1000, pos: 1438) Coordinates: * chain (chain) int64 8B 0 * draw (draw) int64 8kB 0 1 2 3 4 5 6 7 ... 993 994 995 996 997 998 999 * pos (pos) int64 12kB 24 25 26 27 28 29 ... 1615 1618 1619 1620 1621 Data variables: y_hat (chain, draw, pos) float64 12MB ... Attributes: created_at: 2025-07-17T22:04:10.455784+00:00 arviz_version: 0.21.0 inference_library: pymc inference_library_version: 5.22.0 -
<xarray.Dataset> Size: 23kB
Dimensions:  (pos: 1438)
Coordinates:
  * pos      (pos) int64 12kB 24 25 26 27 28 29 ... 1615 1618 1619 1620 1621
Data variables:
    y_hat    (pos) float64 12kB ...
Attributes:
    created_at:                 2025-07-17T20:42:05.086062+00:00
    arviz_version:              0.21.0
    inference_library:          pymc
    inference_library_version:  5.22.0
model\[ \begin{array}{rcl} \text{mu} &\sim & \operatorname{Normal}(\text{<constant>},~0.3)\\\text{sigma} &\sim & \operatorname{HalfNormal}(0,~0.3)\\\text{grw\_sigma} &\sim & \operatorname{HalfNormal}(0,~0.05)\\\text{eps} &\sim & \operatorname{Normal}(0,~1)\\\text{logit\_w} &\sim & \operatorname{Deterministic}(f(\text{eps},~\text{grw\_sigma}))\\\text{w} &\sim & \operatorname{Deterministic}(f(\text{eps},~\text{grw\_sigma}))\\\text{y\_hat} &\sim & \operatorname{MarginalMixture}(f(\text{eps},~\text{grw\_sigma}),~\operatorname{Normal}(\text{mu},~\text{sigma}))\\\text{y\_hat} &\sim & \operatorname{MarginalMixture}(f(\text{eps},~\text{grw\_sigma}),~\operatorname{Normal}(\text{mu},~\text{sigma})) \end{array} \]
Post-hoc decoding of mixture weight
import numpy as np

# Extract posterior samples of w
w_samples = trace.posterior["w"].values   # shape (chains, draws, pos)
w_flat = w_samples.reshape(-1, w_samples.shape[-1])

# Sample z draws
rng = np.random.default_rng()
z_samples = rng.binomial(1, w_flat)   # shape (samples, pos)

# Compute posterior probability of z=1
z_probs = z_samples.mean(axis=0) # per-position probabilityz_probsarray([0.50057143, 0.55657143, 0.64128571, ..., 0.63271429, 0.62814286,
0.60557143], shape=(1438,))z_samplesarray([[1, 0, 1, ..., 1, 1, 1],
[0, 0, 1, ..., 0, 1, 0],
[0, 1, 0, ..., 1, 0, 1],
...,
[0, 1, 0, ..., 1, 1, 1],
[1, 1, 0, ..., 0, 1, 0],
[1, 1, 1, ..., 0, 1, 0]], shape=(7000, 1438))Try some other logic:
threshold = 0.5
# w_samples: shape (n_draws, n_positions)

# How many of the samples are above the threshold?
above_thresh = z_samples < threshold  # shape (samples, n_positions)

# Proportion of Trues in each row:
n_above = above_thresh.sum(axis=0)  # shape: (n_positions,)
# Proportion of samples above threshold for each position
transition_prop = n_above / above_thresh.shape[0]  # shape: (n_positions,)
transition_prop
array([0.49942857, 0.44342857, 0.35871429, ..., 0.36728571, 0.37185714,
       0.39442857], shape=(1438,))
lower_bound = 0.05
upper_bound = 0.95
in_transition = (transition_prop > lower_bound) & (transition_prop < upper_bound)
pos = trace.observed_data.pos.values
# Get positions where transition_prop is in the specified range
idx_in_transition = pos[in_transition]
# transition_positionsLoad the data and plot
import pandas as pd
import matplotlib.pyplot as plt
import matplotlib_inline

matplotlib_inline.backend_inline.set_matplotlib_formats('svg')


# Load the data
resolution = 100000

y = pd.Series(pd.read_csv(f"../data/eigs/sperm.eigs.{resolution}.cis.vecs.tsv", sep="\t")['E1'].values.flatten())
x = pd.Series(np.arange(0,y.shape[0])*resolution)

# Make a DataFrame object
df = pd.DataFrame({"start": x, "e1": y})
df.dropna(inplace=True)

# Plot the data

fig, ax = plt.subplots(figsize=(10, 3))
ax.fill_between(df.start, df.e1, where=df.e1 > 0, color='tab:red', ec='None', step='pre')
ax.fill_between(df.start, df.e1, where=df.e1 < 0, color='tab:blue', ec='None',step='pre')
ax.plot(df.start, transition_prop/0.5-1, color='black', lw=0.5, label='Transition Propensity')


 #Shade the credible interval
plt.fill_between(
    idx_in_transition,
    -1,
    1,
    color='orange',
    alpha=0.3,
    label=f'{int(lower_bound*100)}–{int(upper_bound*100)}% Transition Zone'
)

plt.legend(loc="upper left")
plt.tight_layout()
Include z as s rv in the model
Let’s fetch the results from the stats of the previous notebook. Then, we will use some of the configs that 1) did not have any divergences or other warnings, and 2) otherwise had good results.
import pandas as  pd
import arviz as az

model_comparison = pd.read_csv("../results/model_comparison.csv", index_col=0)
valid = model_comparison.query("warning == False")

top3 = model_comparison[:3]
configs = pd.concat([top3, valid])
configs| rank | elpd_loo | p_loo | elpd_diff | weight | se | dse | warning | scale | |
|---|---|---|---|---|---|---|---|---|---|
| N_T_HT_5_10 | 0 | -13.942824 | 112.407689 | 0.000000 | 0.501709 | 26.172102 | 0.000000 | True | log |
| N_T_HT_10_10 | 1 | -14.232323 | 115.634082 | 0.289498 | 0.232978 | 25.852563 | 4.944408 | True | log |
| N_T_HT_10_5 | 2 | -15.196429 | 113.624439 | 1.253604 | 0.265313 | 25.562472 | 5.420416 | True | log |
| N_T_HN_10 | 13 | -173.060588 | 68.185244 | 159.117764 | 0.000000 | 25.601244 | 7.208652 | False | log |
| N_N_HN | 16 | -190.088696 | 65.218096 | 176.145872 | 0.000000 | 25.583171 | 7.596365 | False | log |
| T_T_HN_10_10 | 17 | -192.626419 | 65.398645 | 178.683595 | 0.000000 | 26.146340 | 7.334733 | False | log |
| T_N_HN_10 | 19 | -208.959314 | 61.984608 | 195.016489 | 0.000000 | 26.085043 | 7.693501 | False | log |
| T_T_HN_5_10 | 20 | -216.997040 | 62.653391 | 203.054216 | 0.000000 | 26.711356 | 7.740838 | False | log |
| T_N_HN_5 | 23 | -233.133380 | 59.696692 | 219.190556 | 0.000000 | 26.665638 | 8.054481 | False | log |
| N_T_HN_5 | 24 | -248.998777 | 58.803980 | 235.055953 | 0.000000 | 25.585742 | 9.124896 | False | log |
| T_T_HN_5_5 | 26 | -291.694932 | 54.513089 | 277.752108 | 0.000000 | 26.616132 | 9.474451 | False | log |
az.plot_compare(configs, order_by_rank=False);
Make a model that includes the latent state \(z\) as a stochastic random variable (rv) in the model on a couple of these configs.
top_n = configs[:6].copy()
top_n.index.to_list()
['N_T_HT_5_10',
'N_T_HT_10_10',
'N_T_HT_10_5',
'N_T_HN_10',
'N_N_HN',
'T_T_HN_10_10']import json
# Fetch the configs from JSON
with open("../results/model_grid.json", "r") as f:
model_grid = json.load(f)
# Extract the configs for the top 3 models
configs = [config
                 for config in model_grid
                 if config['name'] in top_n.index]
configs
[{'name': 'N_N_HN',
'comp_dist': 'Normal',
'comp_kwargs': {},
'eps_dist': 'Normal',
'eps_kwargs': {'mu': 0.0, 'sigma': 1.0},
'grw_sigma_dist': 'HalfNormal',
'grw_sigma_kwargs': {'sigma': 0.05},
'mu_mu': [-0.5, 0.5],
'mu_sigma': 0.3,
'sigma': 0.3},
{'name': 'N_T_HN_10',
'comp_dist': 'Normal',
'comp_kwargs': {},
'eps_dist': 'StudentT',
'eps_kwargs': {'nu': 10, 'mu': 0.0, 'sigma': 1.0},
'grw_sigma_dist': 'HalfNormal',
'grw_sigma_kwargs': {'sigma': 0.05},
'mu_mu': [-0.5, 0.5],
'mu_sigma': 0.3,
'sigma': 0.3},
{'name': 'N_T_HT_10_10',
'comp_dist': 'Normal',
'comp_kwargs': {},
'eps_dist': 'StudentT',
'eps_kwargs': {'nu': 10, 'mu': 0.0, 'sigma': 1.0},
'grw_sigma_dist': 'HalfStudentT',
'grw_sigma_kwargs': {'nu': 10, 'sigma': 0.05},
'mu_mu': [-0.5, 0.5],
'mu_sigma': 0.3,
'sigma': 0.3},
{'name': 'N_T_HT_10_5',
'comp_dist': 'Normal',
'comp_kwargs': {},
'eps_dist': 'StudentT',
'eps_kwargs': {'nu': 10, 'mu': 0.0, 'sigma': 1.0},
'grw_sigma_dist': 'HalfStudentT',
'grw_sigma_kwargs': {'nu': 5, 'sigma': 0.01},
'mu_mu': [-0.5, 0.5],
'mu_sigma': 0.3,
'sigma': 0.3},
{'name': 'N_T_HT_5_10',
'comp_dist': 'Normal',
'comp_kwargs': {},
'eps_dist': 'StudentT',
'eps_kwargs': {'nu': 5, 'mu': 0.0, 'sigma': 0.5},
'grw_sigma_dist': 'HalfStudentT',
'grw_sigma_kwargs': {'nu': 10, 'sigma': 0.05},
'mu_mu': [-0.5, 0.5],
'mu_sigma': 0.3,
'sigma': 0.3},
{'name': 'T_T_HN_10_10',
'comp_dist': 'StudentT',
'comp_kwargs': {'nu': 10},
'eps_dist': 'StudentT',
'eps_kwargs': {'nu': 10, 'mu': 0.0, 'sigma': 1.0},
'grw_sigma_dist': 'HalfNormal',
'grw_sigma_kwargs': {'sigma': 0.05},
'mu_mu': [-0.5, 0.5],
'mu_sigma': 0.3,
'sigma': 0.3}]Model builder
import pymc as pm
import pytensor.tensor as pt

def build_z_model_from_config(df, cfg):
    """
    Build a PyMC model based on the provided configuration dictionary.
    """

    with pm.Model(coords={"pos": df.index.values}) as model:
        e1 = pm.Data("e1", df.e1.values, dims="pos")

        mu = pm.Normal("mu", mu=cfg['mu_mu'], sigma=cfg['mu_sigma'],
                       transform=pm.distributions.transforms.ordered, shape=2)
        sigma = pm.HalfNormal("sigma", sigma=cfg['sigma'], shape=2)

        # components: Normal or StudentT
        if cfg['comp_dist'] == "Normal":
            components = pm.Normal.dist(mu=mu, sigma=sigma, shape=2)
        else:
            components = pm.StudentT.dist(mu=mu, sigma=sigma, **cfg['comp_kwargs'], shape=2)

        # grw_sigma: HalfNormal or HalfStudentT
        if cfg['grw_sigma_dist'] == "HalfNormal":
            grw_sigma = pm.HalfNormal("grw_sigma", **cfg['grw_sigma_kwargs'])
        else:
            grw_sigma = pm.HalfStudentT("grw_sigma", **cfg['grw_sigma_kwargs'])

        # eps: Normal or StudentT
        if cfg['eps_dist'] == "Normal":
            eps = pm.Normal("eps", dims="pos", **cfg['eps_kwargs'])
        else:
            eps = pm.StudentT("eps", dims="pos", **cfg['eps_kwargs'])

        logit_w = pm.Deterministic("logit_w", pt.cumsum(eps * grw_sigma), dims="pos")
        w = pm.Deterministic("w", pm.math.sigmoid(logit_w), dims="pos")

        # Make a latent variable for the mixture model
        z = pm.Bernoulli("z", p=w, dims="pos")


        y_hat = pm.Mixture("y_hat", w=pt.stack([z, 1-z], axis=1), comp_dists=components,
                           observed=e1, dims='pos')

    return model
Model sampler
from datetime import datetime

def log(msg, path=".05_PyMC_bernoulli_z.log", overwrite=False):
    print(f"LOG: {msg}")
    if overwrite:
        with open(path, "w") as f:
            f.write(msg + "\n")
    else:
        with open(path, "a") as f:
            f.write(msg + "\n")


# Reset the log file
log("Resetting log... \n", overwrite=True)

model_traces = {}


for i, cfg in enumerate(configs):
    name = cfg['name']

    if name in model_traces:
        continue
    else:
        model_traces[name] = {'model': None, 'trace': None, 'scores': None}


    log(f"Sampling {name}...")
    try:
        start = datetime.now()
        log(f"Started at {start.strftime('%H:%M:%S')}")
        model_traces[name]['model'] = build_z_model_from_config(df, cfg)
        model = model_traces[name]['model']
        trace = pm.sample(draws=1500, tune=1500, chains=7, cores=7, progressbar=False, model=model)
        model_traces[name]['trace'] = trace
        log(f"--> Took {(datetime.now()-start).total_seconds()} seconds!\n")
    except Exception as e:
        log(f"Model {name} failed: {e}\n")
LOG: Resetting log...
LOG: Sampling N_N_HN...
LOG: Started at 21:22:45Multiprocess sampling (7 chains in 7 jobs)
CompoundStep
>NUTS: [mu, sigma, grw_sigma, eps]
>BinaryGibbsMetropolis: [z]
Sampling 7 chains for 1_500 tune and 1_500 draw iterations (10_500 + 10_500 draws total) took 1011 seconds.
/home/sojern/miniconda3/envs/pymc/lib/python3.13/site-packages/arviz/stats/diagnostics.py:596: RuntimeWarning: invalid value encountered in scalar divide
(between_chain_variance / within_chain_variance + num_samples - 1) / (num_samples)LOG: --> Took 1051.858233 seconds!
LOG: Sampling N_T_HN_10...
LOG: Started at 21:40:17Multiprocess sampling (7 chains in 7 jobs)
CompoundStep
>NUTS: [mu, sigma, grw_sigma, eps]
>BinaryGibbsMetropolis: [z]
Sampling 7 chains for 1_500 tune and 1_500 draw iterations (10_500 + 10_500 draws total) took 997 seconds.
/home/sojern/miniconda3/envs/pymc/lib/python3.13/site-packages/arviz/stats/diagnostics.py:596: RuntimeWarning: invalid value encountered in scalar divide
(between_chain_variance / within_chain_variance + num_samples - 1) / (num_samples)LOG: --> Took 1009.303444 seconds!
LOG: Sampling N_T_HT_10_10...
LOG: Started at 21:57:06Multiprocess sampling (7 chains in 7 jobs)
CompoundStep
>NUTS: [mu, sigma, grw_sigma, eps]
>BinaryGibbsMetropolis: [z]
Sampling 7 chains for 1_500 tune and 1_500 draw iterations (10_500 + 10_500 draws total) took 1286 seconds.
/home/sojern/miniconda3/envs/pymc/lib/python3.13/site-packages/arviz/stats/diagnostics.py:596: RuntimeWarning: invalid value encountered in scalar divide
(between_chain_variance / within_chain_variance + num_samples - 1) / (num_samples)
There were 531 divergences after tuning. Increase `target_accept` or reparameterize.
Chain 0 reached the maximum tree depth. Increase `max_treedepth`, increase `target_accept` or reparameterize.
Chain 1 reached the maximum tree depth. Increase `max_treedepth`, increase `target_accept` or reparameterize.
Chain 2 reached the maximum tree depth. Increase `max_treedepth`, increase `target_accept` or reparameterize.
Chain 3 reached the maximum tree depth. Increase `max_treedepth`, increase `target_accept` or reparameterize.
Chain 4 reached the maximum tree depth. Increase `max_treedepth`, increase `target_accept` or reparameterize.
Chain 5 reached the maximum tree depth. Increase `max_treedepth`, increase `target_accept` or reparameterize.
Chain 6 reached the maximum tree depth. Increase `max_treedepth`, increase `target_accept` or reparameterize.
The rhat statistic is larger than 1.01 for some parameters. This indicates problems during sampling. See https://arxiv.org/abs/1903.08008 for details
The effective sample size per chain is smaller than 100 for some parameters. A higher number is needed for reliable rhat and ess computation. See https://arxiv.org/abs/1903.08008 for detailsLOG: --> Took 1297.701065 seconds!
LOG: Sampling N_T_HT_10_5...
LOG: Started at 22:18:44Multiprocess sampling (7 chains in 7 jobs)
CompoundStep
>NUTS: [mu, sigma, grw_sigma, eps]
>BinaryGibbsMetropolis: [z]
Sampling 7 chains for 1_500 tune and 1_500 draw iterations (10_500 + 10_500 draws total) took 1245 seconds.
/home/sojern/miniconda3/envs/pymc/lib/python3.13/site-packages/arviz/stats/diagnostics.py:596: RuntimeWarning: invalid value encountered in scalar divide
(between_chain_variance / within_chain_variance + num_samples - 1) / (num_samples)
There were 3138 divergences after tuning. Increase `target_accept` or reparameterize.
Chain 0 reached the maximum tree depth. Increase `max_treedepth`, increase `target_accept` or reparameterize.
Chain 1 reached the maximum tree depth. Increase `max_treedepth`, increase `target_accept` or reparameterize.
Chain 2 reached the maximum tree depth. Increase `max_treedepth`, increase `target_accept` or reparameterize.
Chain 3 reached the maximum tree depth. Increase `max_treedepth`, increase `target_accept` or reparameterize.
Chain 4 reached the maximum tree depth. Increase `max_treedepth`, increase `target_accept` or reparameterize.
Chain 5 reached the maximum tree depth. Increase `max_treedepth`, increase `target_accept` or reparameterize.
Chain 6 reached the maximum tree depth. Increase `max_treedepth`, increase `target_accept` or reparameterize.
The rhat statistic is larger than 1.01 for some parameters. This indicates problems during sampling. See https://arxiv.org/abs/1903.08008 for details
The effective sample size per chain is smaller than 100 for some parameters. A higher number is needed for reliable rhat and ess computation. See https://arxiv.org/abs/1903.08008 for detailsLOG: --> Took 1259.939658 seconds!
LOG: Sampling N_T_HT_5_10...
LOG: Started at 22:39:44Multiprocess sampling (7 chains in 7 jobs)
CompoundStep
>NUTS: [mu, sigma, grw_sigma, eps]
>BinaryGibbsMetropolis: [z]
Sampling 7 chains for 1_500 tune and 1_500 draw iterations (10_500 + 10_500 draws total) took 1306 seconds.
/home/sojern/miniconda3/envs/pymc/lib/python3.13/site-packages/arviz/stats/diagnostics.py:596: RuntimeWarning: invalid value encountered in scalar divide
(between_chain_variance / within_chain_variance + num_samples - 1) / (num_samples)
There were 529 divergences after tuning. Increase `target_accept` or reparameterize.
Chain 0 reached the maximum tree depth. Increase `max_treedepth`, increase `target_accept` or reparameterize.
Chain 1 reached the maximum tree depth. Increase `max_treedepth`, increase `target_accept` or reparameterize.
Chain 2 reached the maximum tree depth. Increase `max_treedepth`, increase `target_accept` or reparameterize.
Chain 3 reached the maximum tree depth. Increase `max_treedepth`, increase `target_accept` or reparameterize.
Chain 4 reached the maximum tree depth. Increase `max_treedepth`, increase `target_accept` or reparameterize.
Chain 5 reached the maximum tree depth. Increase `max_treedepth`, increase `target_accept` or reparameterize.
Chain 6 reached the maximum tree depth. Increase `max_treedepth`, increase `target_accept` or reparameterize.
The rhat statistic is larger than 1.01 for some parameters. This indicates problems during sampling. See https://arxiv.org/abs/1903.08008 for details
The effective sample size per chain is smaller than 100 for some parameters. A higher number is needed for reliable rhat and ess computation. See https://arxiv.org/abs/1903.08008 for detailsLOG: --> Took 1317.07734 seconds!
LOG: Sampling T_T_HN_10_10...
LOG: Started at 23:01:41Multiprocess sampling (7 chains in 7 jobs)
CompoundStep
>NUTS: [mu, sigma, grw_sigma, eps]
>BinaryGibbsMetropolis: [z]
Sampling 7 chains for 1_500 tune and 1_500 draw iterations (10_500 + 10_500 draws total) took 1111 seconds.
/home/sojern/miniconda3/envs/pymc/lib/python3.13/site-packages/arviz/stats/diagnostics.py:596: RuntimeWarning: invalid value encountered in scalar divide
(between_chain_variance / within_chain_variance + num_samples - 1) / (num_samples)LOG: --> Took 1122.248001 seconds!
for name, model_dict in model_traces.items():
    # model_dict.keys(): {'model', 'trace', 'scores'}

    try:
        print(name)
        pm.compute_log_likelihood(
            model_dict['trace'],
            model=model_dict['model'],
            progressbar=False)
    except Exception as e:
        print(f"{name} failed computing log_likelihood: {e}")
    try:
        prior_predictive = pm.sample_prior_predictive(
            1000,
            model=model_dict['model'])
        model_dict['trace'].extend(prior_predictive)
    except Exception as e:
        print(f"{name} failed sampling prior predictive: {e}")
    try:
        posterior_predictive = pm.sample_posterior_predictive(
            model_dict['trace'],
            model=model_dict['model'],
            progressbar=False)
        model_dict['trace'].extend(posterior_predictive)
    except Exception as e:
        print(f"{name} failed sampling posterior predictive: {e}")

    try:
        loo = az.loo(model_dict['trace'])
        waic = az.waic(model_dict['trace'])
        model_dict['scores'] = {
            "loo": loo,
            "waic": waic
        }
    except Exception as e:
print(f"{name} failed during loo/waic: {e}")N_N_HNSampling: [eps, grw_sigma, mu, sigma, y_hat, z]
Sampling: [y_hat]
/home/sojern/miniconda3/envs/pymc/lib/python3.13/site-packages/arviz/stats/stats.py:1045: RuntimeWarning: overflow encountered in exp
weights = 1 / np.exp(len_scale - len_scale[:, None]).sum(axis=1)
/home/sojern/miniconda3/envs/pymc/lib/python3.13/site-packages/numpy/_core/_methods.py:52: RuntimeWarning: overflow encountered in reduce
return umr_sum(a, axis, dtype, out, keepdims, initial, where)
/home/sojern/miniconda3/envs/pymc/lib/python3.13/site-packages/arviz/stats/stats.py:797: UserWarning: Estimated shape parameter of Pareto distribution is greater than 0.70 for one or more samples. You should consider using a more robust model, this is because importance sampling is less likely to work well if the marginal posterior and LOO posterior are very different. This is more likely to happen with a non-robust model and highly influential observations.
warnings.warn(
/home/sojern/miniconda3/envs/pymc/lib/python3.13/site-packages/arviz/stats/stats.py:1655: UserWarning: For one or more samples the posterior variance of the log predictive densities exceeds 0.4. This could be indication of WAIC starting to fail.
See http://arxiv.org/abs/1507.04544 for details
warnings.warn(N_T_HN_10Sampling: [eps, grw_sigma, mu, sigma, y_hat, z]
Sampling: [y_hat]
/home/sojern/miniconda3/envs/pymc/lib/python3.13/site-packages/arviz/stats/stats.py:1045: RuntimeWarning: overflow encountered in exp
weights = 1 / np.exp(len_scale - len_scale[:, None]).sum(axis=1)
/home/sojern/miniconda3/envs/pymc/lib/python3.13/site-packages/numpy/_core/_methods.py:52: RuntimeWarning: overflow encountered in reduce
return umr_sum(a, axis, dtype, out, keepdims, initial, where)
/home/sojern/miniconda3/envs/pymc/lib/python3.13/site-packages/arviz/stats/stats.py:797: UserWarning: Estimated shape parameter of Pareto distribution is greater than 0.70 for one or more samples. You should consider using a more robust model, this is because importance sampling is less likely to work well if the marginal posterior and LOO posterior are very different. This is more likely to happen with a non-robust model and highly influential observations.
warnings.warn(
/home/sojern/miniconda3/envs/pymc/lib/python3.13/site-packages/arviz/stats/stats.py:1655: UserWarning: For one or more samples the posterior variance of the log predictive densities exceeds 0.4. This could be indication of WAIC starting to fail.
See http://arxiv.org/abs/1507.04544 for details
warnings.warn(N_T_HT_10_10Sampling: [eps, grw_sigma, mu, sigma, y_hat, z]
Sampling: [y_hat]
/home/sojern/miniconda3/envs/pymc/lib/python3.13/site-packages/arviz/stats/stats.py:1045: RuntimeWarning: overflow encountered in exp
weights = 1 / np.exp(len_scale - len_scale[:, None]).sum(axis=1)
/home/sojern/miniconda3/envs/pymc/lib/python3.13/site-packages/numpy/_core/_methods.py:52: RuntimeWarning: overflow encountered in reduce
return umr_sum(a, axis, dtype, out, keepdims, initial, where)
/home/sojern/miniconda3/envs/pymc/lib/python3.13/site-packages/arviz/stats/stats.py:797: UserWarning: Estimated shape parameter of Pareto distribution is greater than 0.70 for one or more samples. You should consider using a more robust model, this is because importance sampling is less likely to work well if the marginal posterior and LOO posterior are very different. This is more likely to happen with a non-robust model and highly influential observations.
warnings.warn(
/home/sojern/miniconda3/envs/pymc/lib/python3.13/site-packages/arviz/stats/stats.py:1655: UserWarning: For one or more samples the posterior variance of the log predictive densities exceeds 0.4. This could be indication of WAIC starting to fail.
See http://arxiv.org/abs/1507.04544 for details
warnings.warn(N_T_HT_10_5Sampling: [eps, grw_sigma, mu, sigma, y_hat, z]
Sampling: [y_hat]
/home/sojern/miniconda3/envs/pymc/lib/python3.13/site-packages/arviz/stats/stats.py:1045: RuntimeWarning: overflow encountered in exp
weights = 1 / np.exp(len_scale - len_scale[:, None]).sum(axis=1)
/home/sojern/miniconda3/envs/pymc/lib/python3.13/site-packages/numpy/_core/_methods.py:52: RuntimeWarning: overflow encountered in reduce
return umr_sum(a, axis, dtype, out, keepdims, initial, where)
/home/sojern/miniconda3/envs/pymc/lib/python3.13/site-packages/arviz/stats/stats.py:797: UserWarning: Estimated shape parameter of Pareto distribution is greater than 0.70 for one or more samples. You should consider using a more robust model, this is because importance sampling is less likely to work well if the marginal posterior and LOO posterior are very different. This is more likely to happen with a non-robust model and highly influential observations.
warnings.warn(
/home/sojern/miniconda3/envs/pymc/lib/python3.13/site-packages/arviz/stats/stats.py:1655: UserWarning: For one or more samples the posterior variance of the log predictive densities exceeds 0.4. This could be indication of WAIC starting to fail.
See http://arxiv.org/abs/1507.04544 for details
warnings.warn(N_T_HT_5_10Sampling: [eps, grw_sigma, mu, sigma, y_hat, z]
Sampling: [y_hat]
/home/sojern/miniconda3/envs/pymc/lib/python3.13/site-packages/arviz/stats/stats.py:1045: RuntimeWarning: overflow encountered in exp
weights = 1 / np.exp(len_scale - len_scale[:, None]).sum(axis=1)
/home/sojern/miniconda3/envs/pymc/lib/python3.13/site-packages/numpy/_core/_methods.py:52: RuntimeWarning: overflow encountered in reduce
return umr_sum(a, axis, dtype, out, keepdims, initial, where)
/home/sojern/miniconda3/envs/pymc/lib/python3.13/site-packages/arviz/stats/stats.py:797: UserWarning: Estimated shape parameter of Pareto distribution is greater than 0.70 for one or more samples. You should consider using a more robust model, this is because importance sampling is less likely to work well if the marginal posterior and LOO posterior are very different. This is more likely to happen with a non-robust model and highly influential observations.
warnings.warn(
/home/sojern/miniconda3/envs/pymc/lib/python3.13/site-packages/arviz/stats/stats.py:1655: UserWarning: For one or more samples the posterior variance of the log predictive densities exceeds 0.4. This could be indication of WAIC starting to fail.
See http://arxiv.org/abs/1507.04544 for details
warnings.warn(T_T_HN_10_10Sampling: [eps, grw_sigma, mu, sigma, y_hat, z]
Sampling: [y_hat]
/home/sojern/miniconda3/envs/pymc/lib/python3.13/site-packages/arviz/stats/stats.py:1045: RuntimeWarning: overflow encountered in exp
weights = 1 / np.exp(len_scale - len_scale[:, None]).sum(axis=1)
/home/sojern/miniconda3/envs/pymc/lib/python3.13/site-packages/numpy/_core/_methods.py:52: RuntimeWarning: overflow encountered in reduce
return umr_sum(a, axis, dtype, out, keepdims, initial, where)
/home/sojern/miniconda3/envs/pymc/lib/python3.13/site-packages/arviz/stats/stats.py:797: UserWarning: Estimated shape parameter of Pareto distribution is greater than 0.70 for one or more samples. You should consider using a more robust model, this is because importance sampling is less likely to work well if the marginal posterior and LOO posterior are very different. This is more likely to happen with a non-robust model and highly influential observations.
warnings.warn(
/home/sojern/miniconda3/envs/pymc/lib/python3.13/site-packages/arviz/stats/stats.py:1655: UserWarning: For one or more samples the posterior variance of the log predictive densities exceeds 0.4. This could be indication of WAIC starting to fail.
See http://arxiv.org/abs/1507.04544 for details
warnings.warn(matplotlib_inline.backend_inline.set_matplotlib_formats('retina')
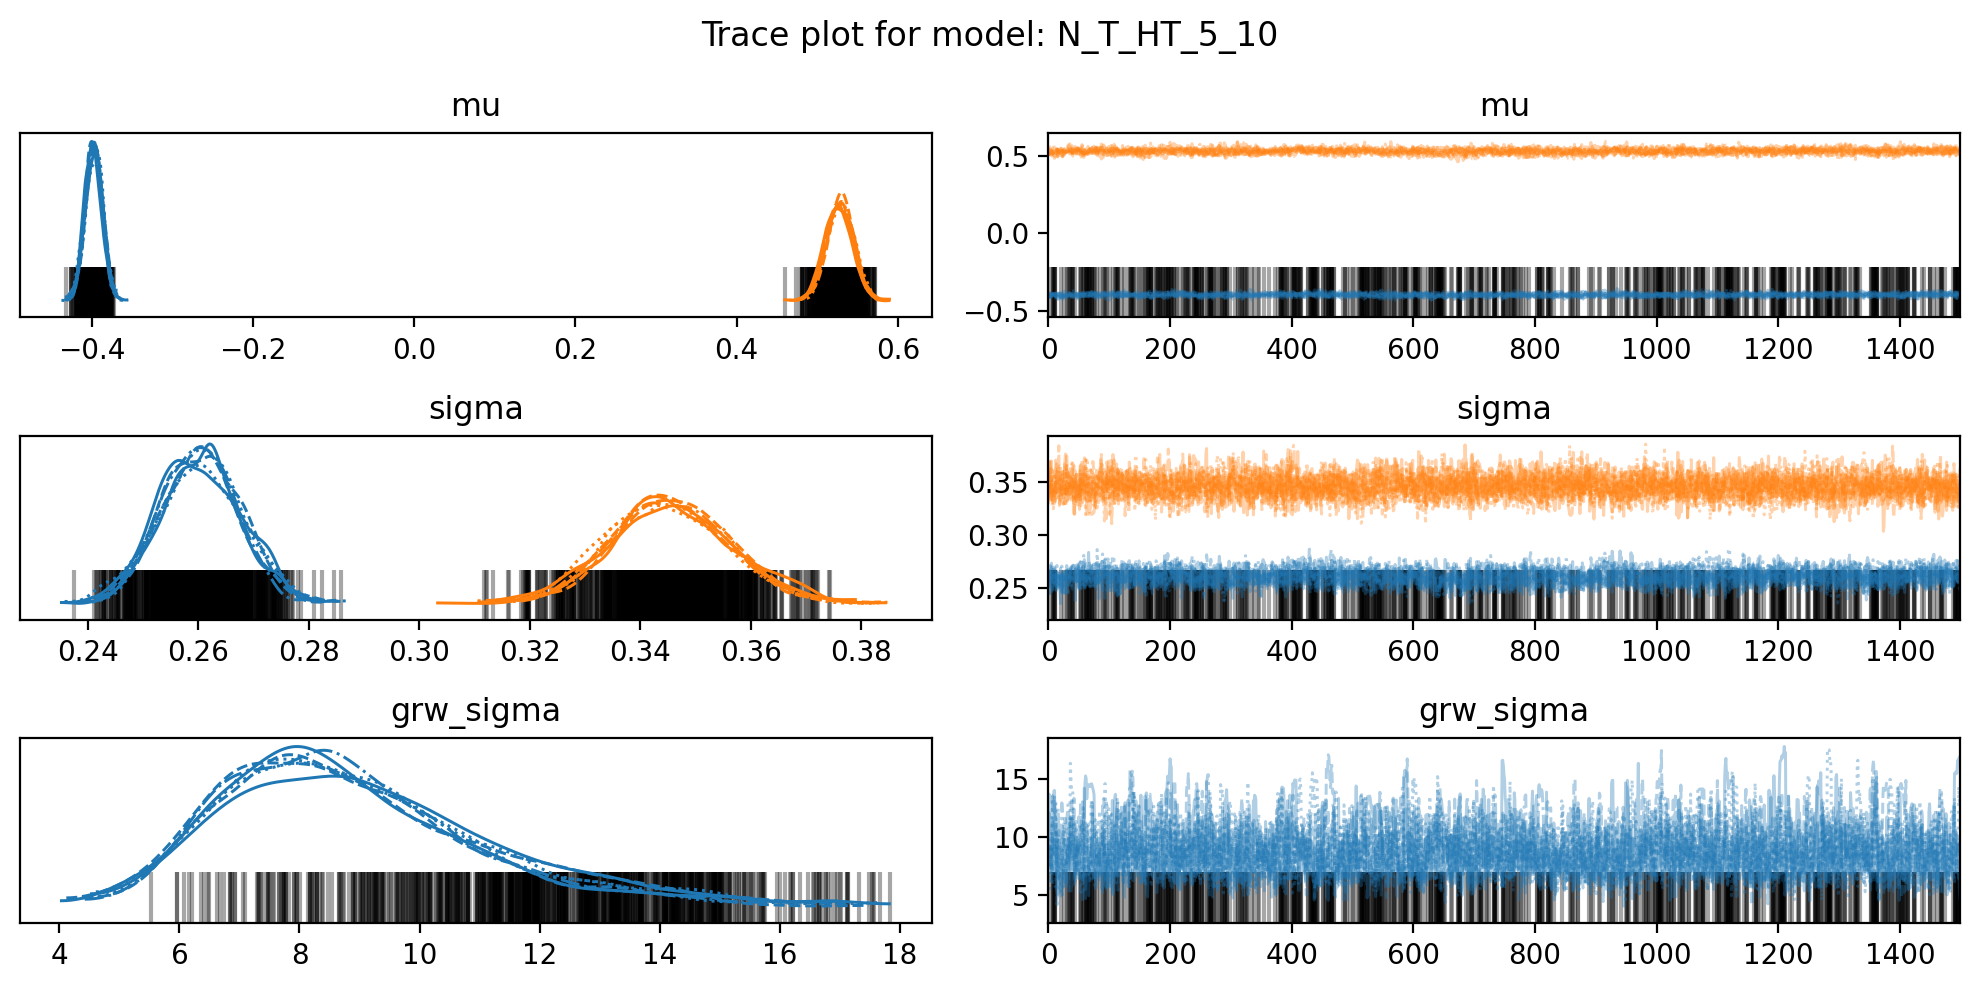
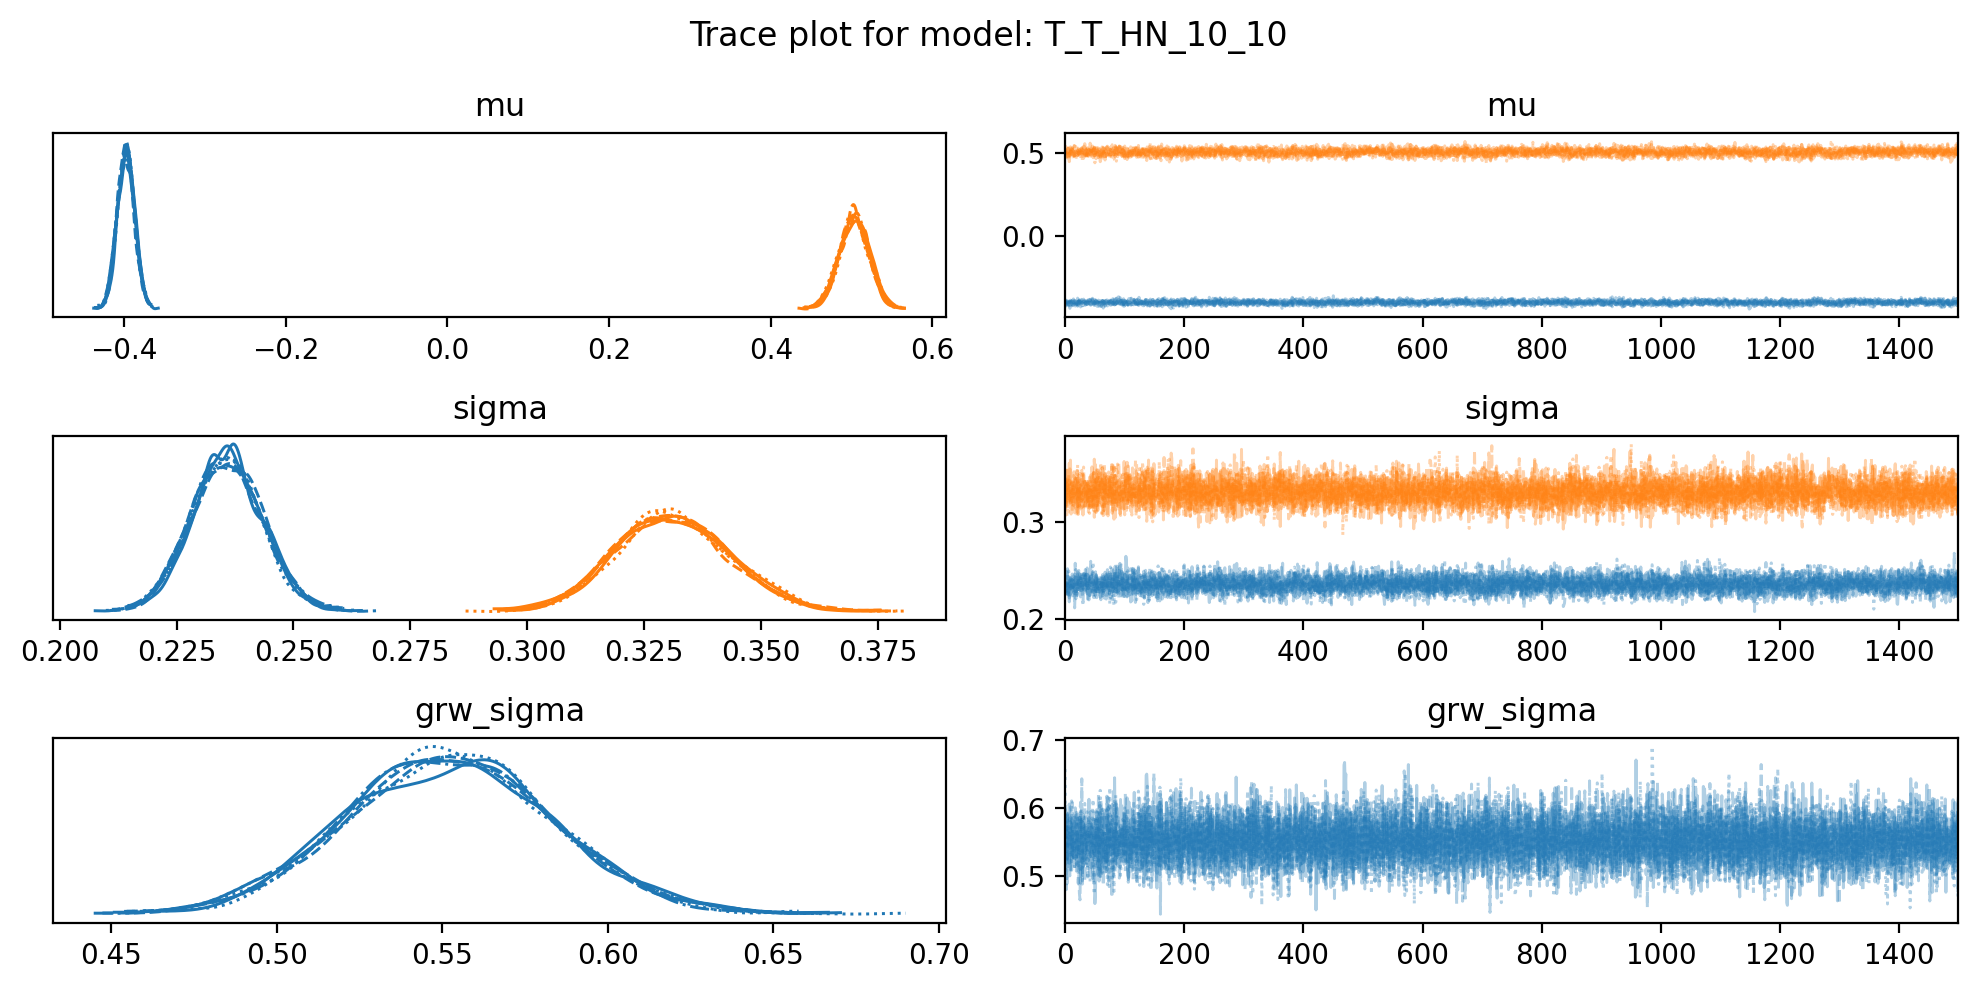
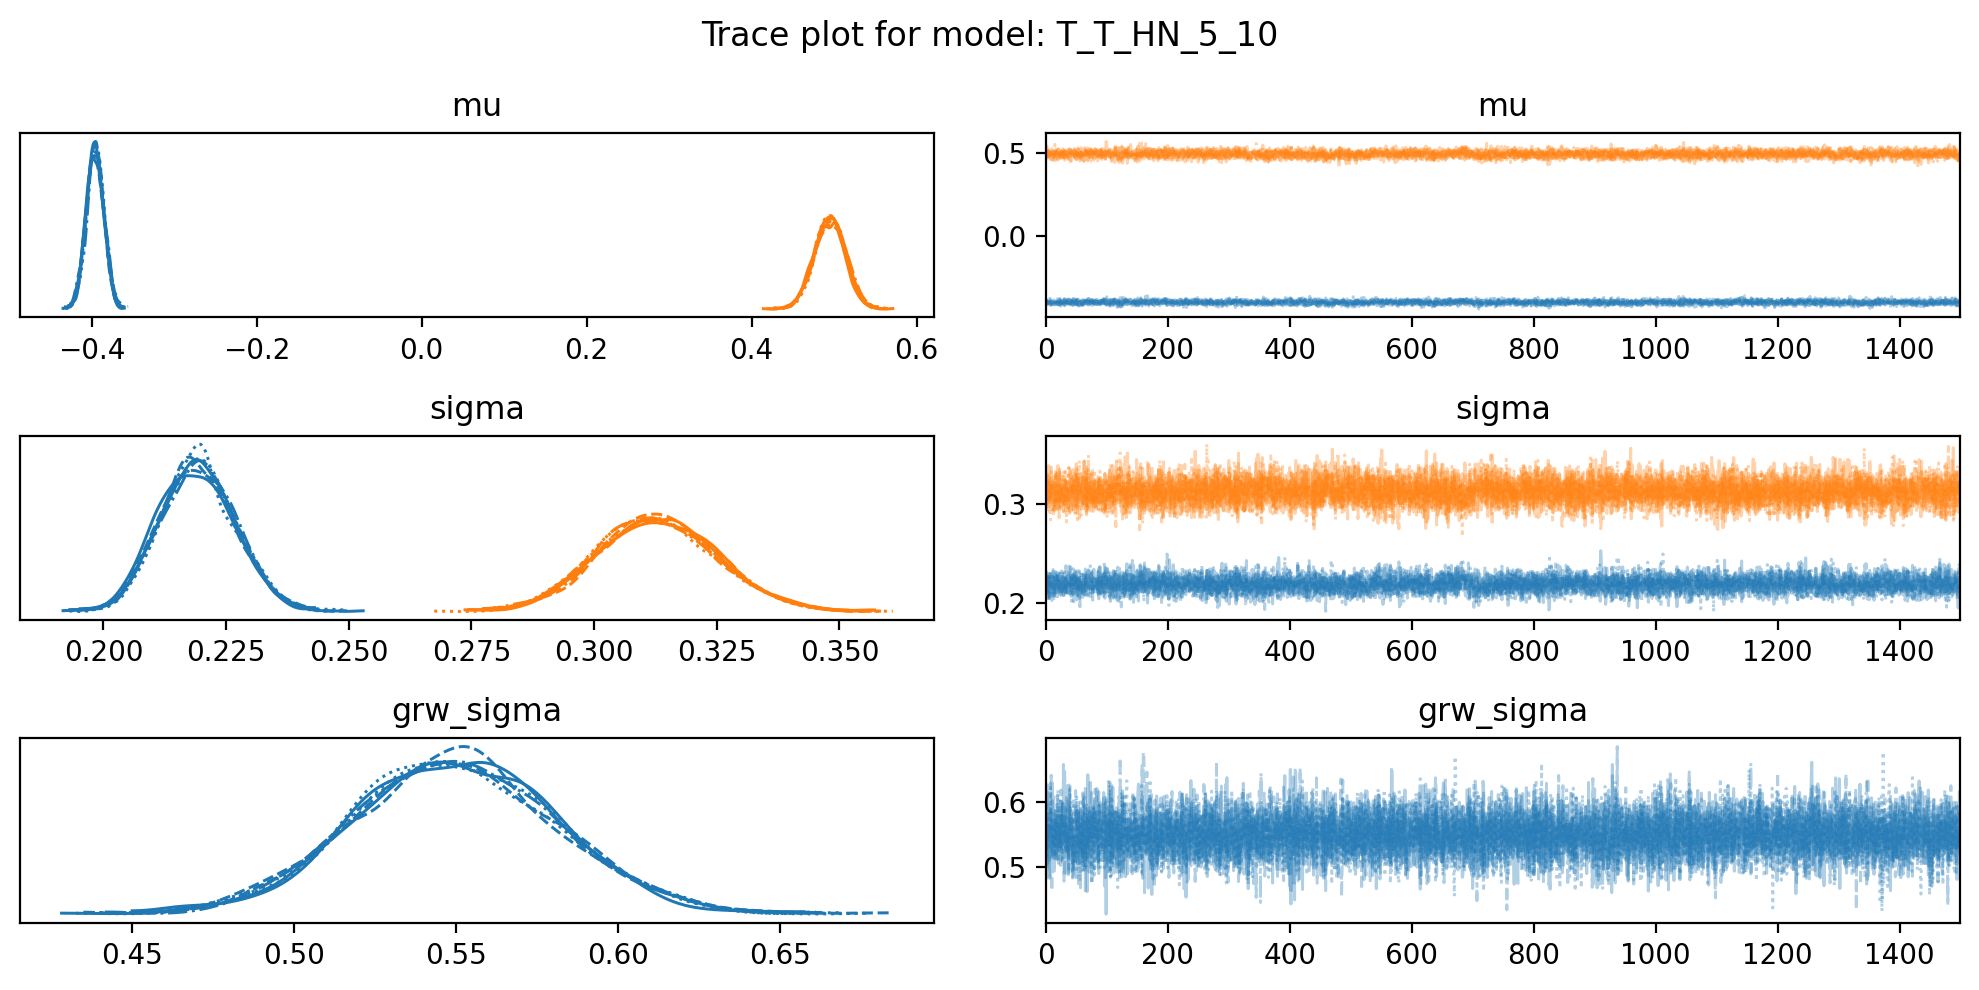
for name,d in model_traces.items():
trace = d['trace']
score = d['scores']['loo']
f, axs = plt.subplots(3, 2, figsize=(10, 5))
az.plot_trace(trace, var_names=["mu", "sigma", "grw_sigma"], compact=True, axes = axs)
plt.suptitle(f"Trace plot for model: {name}")
plt.tight_layout()
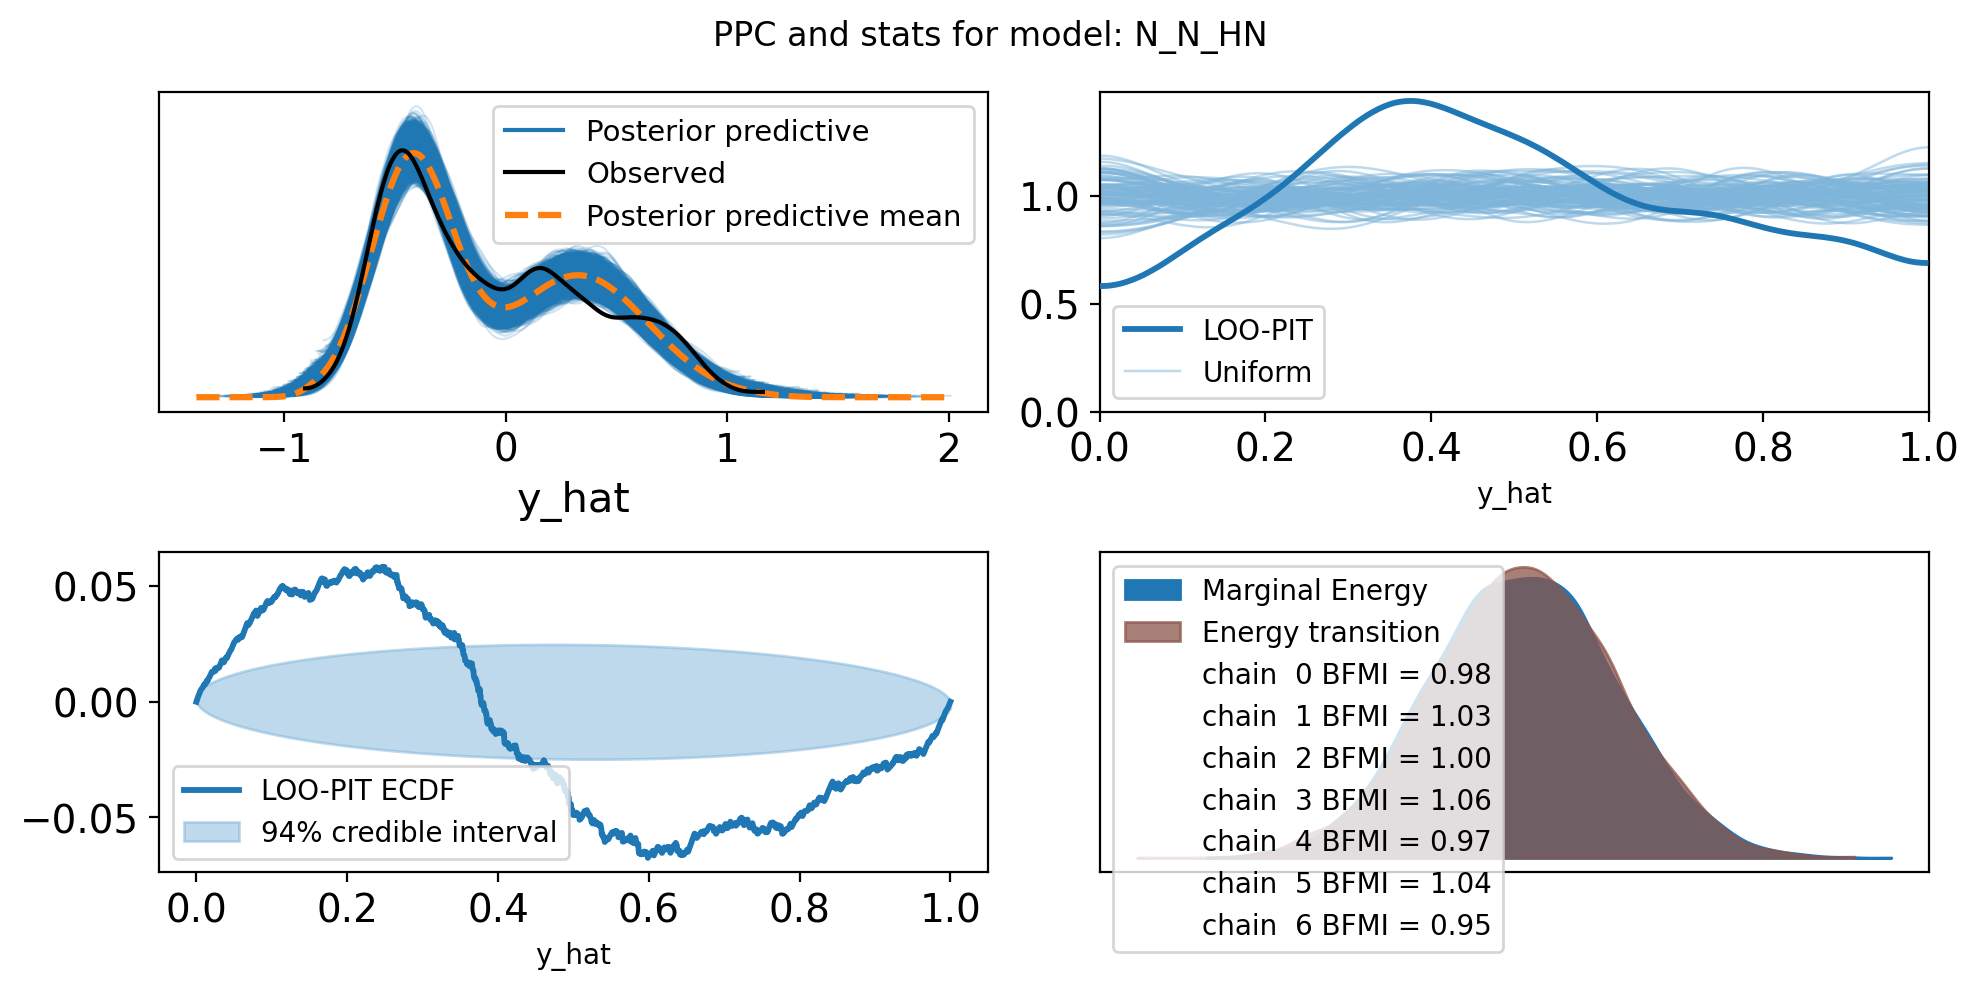
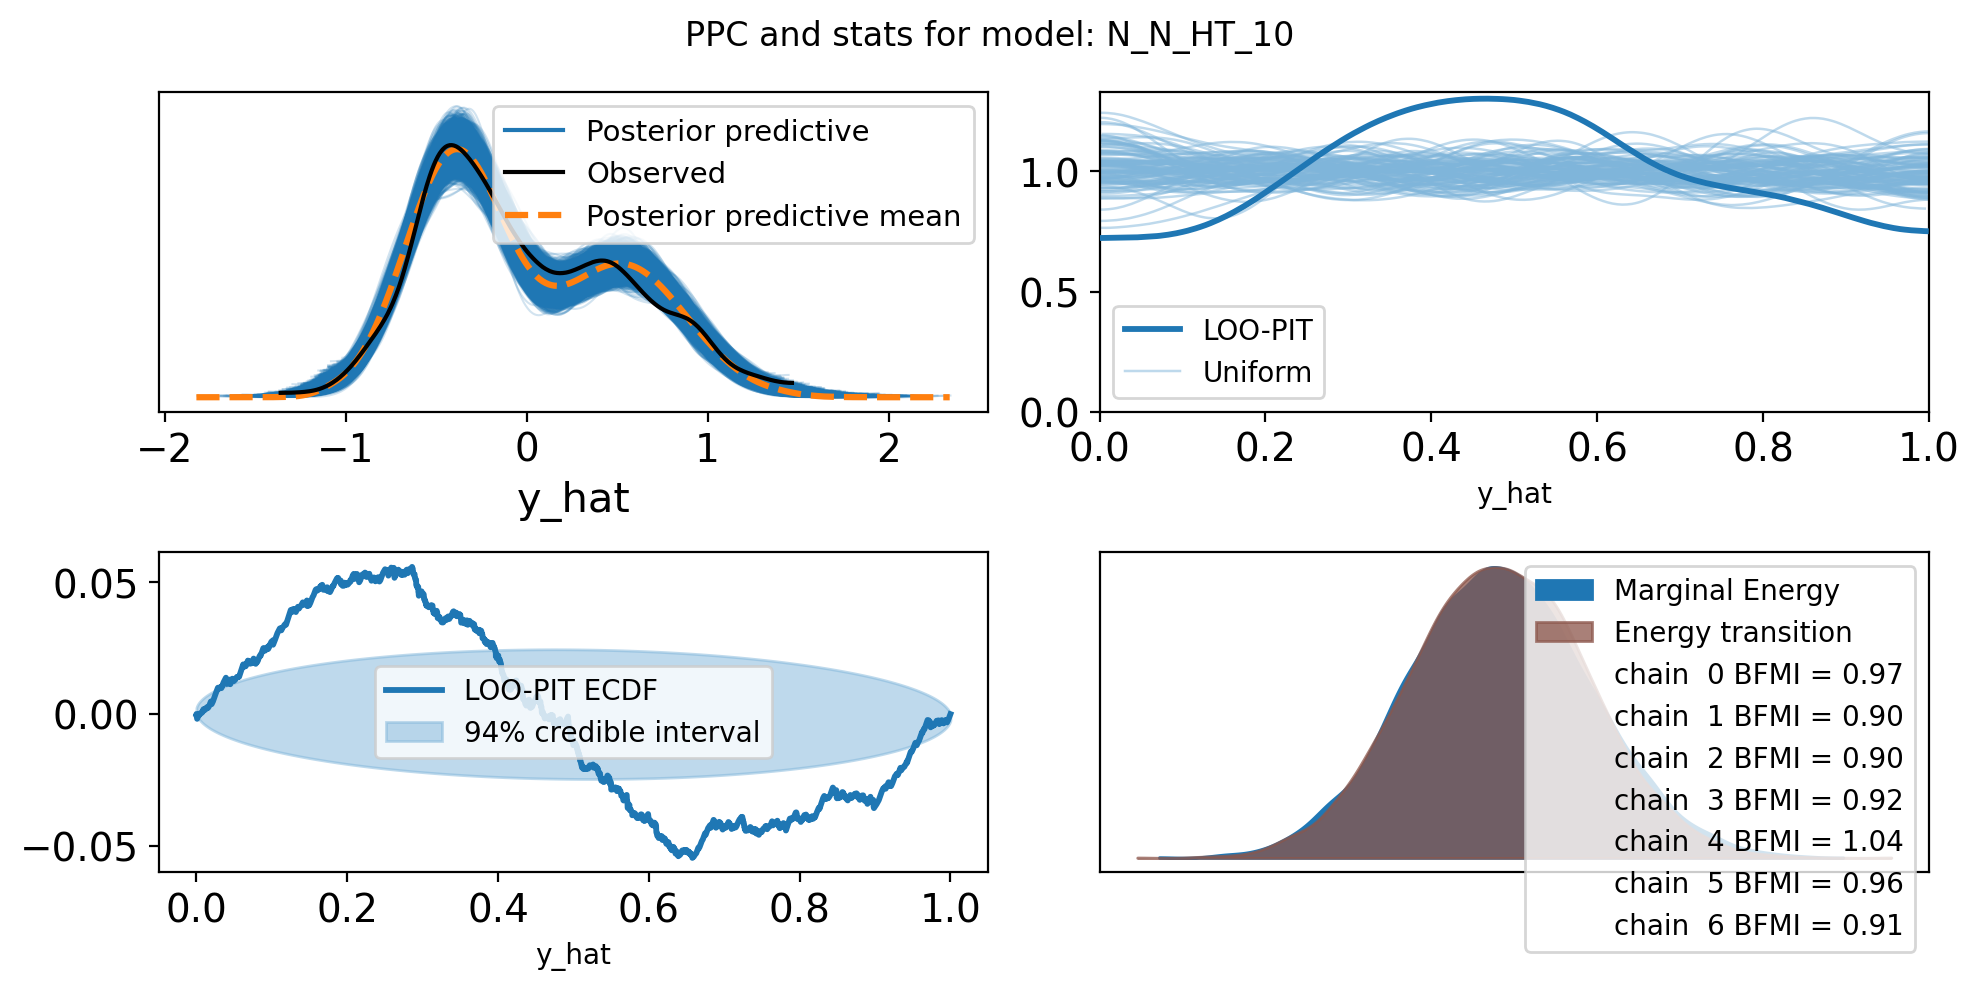
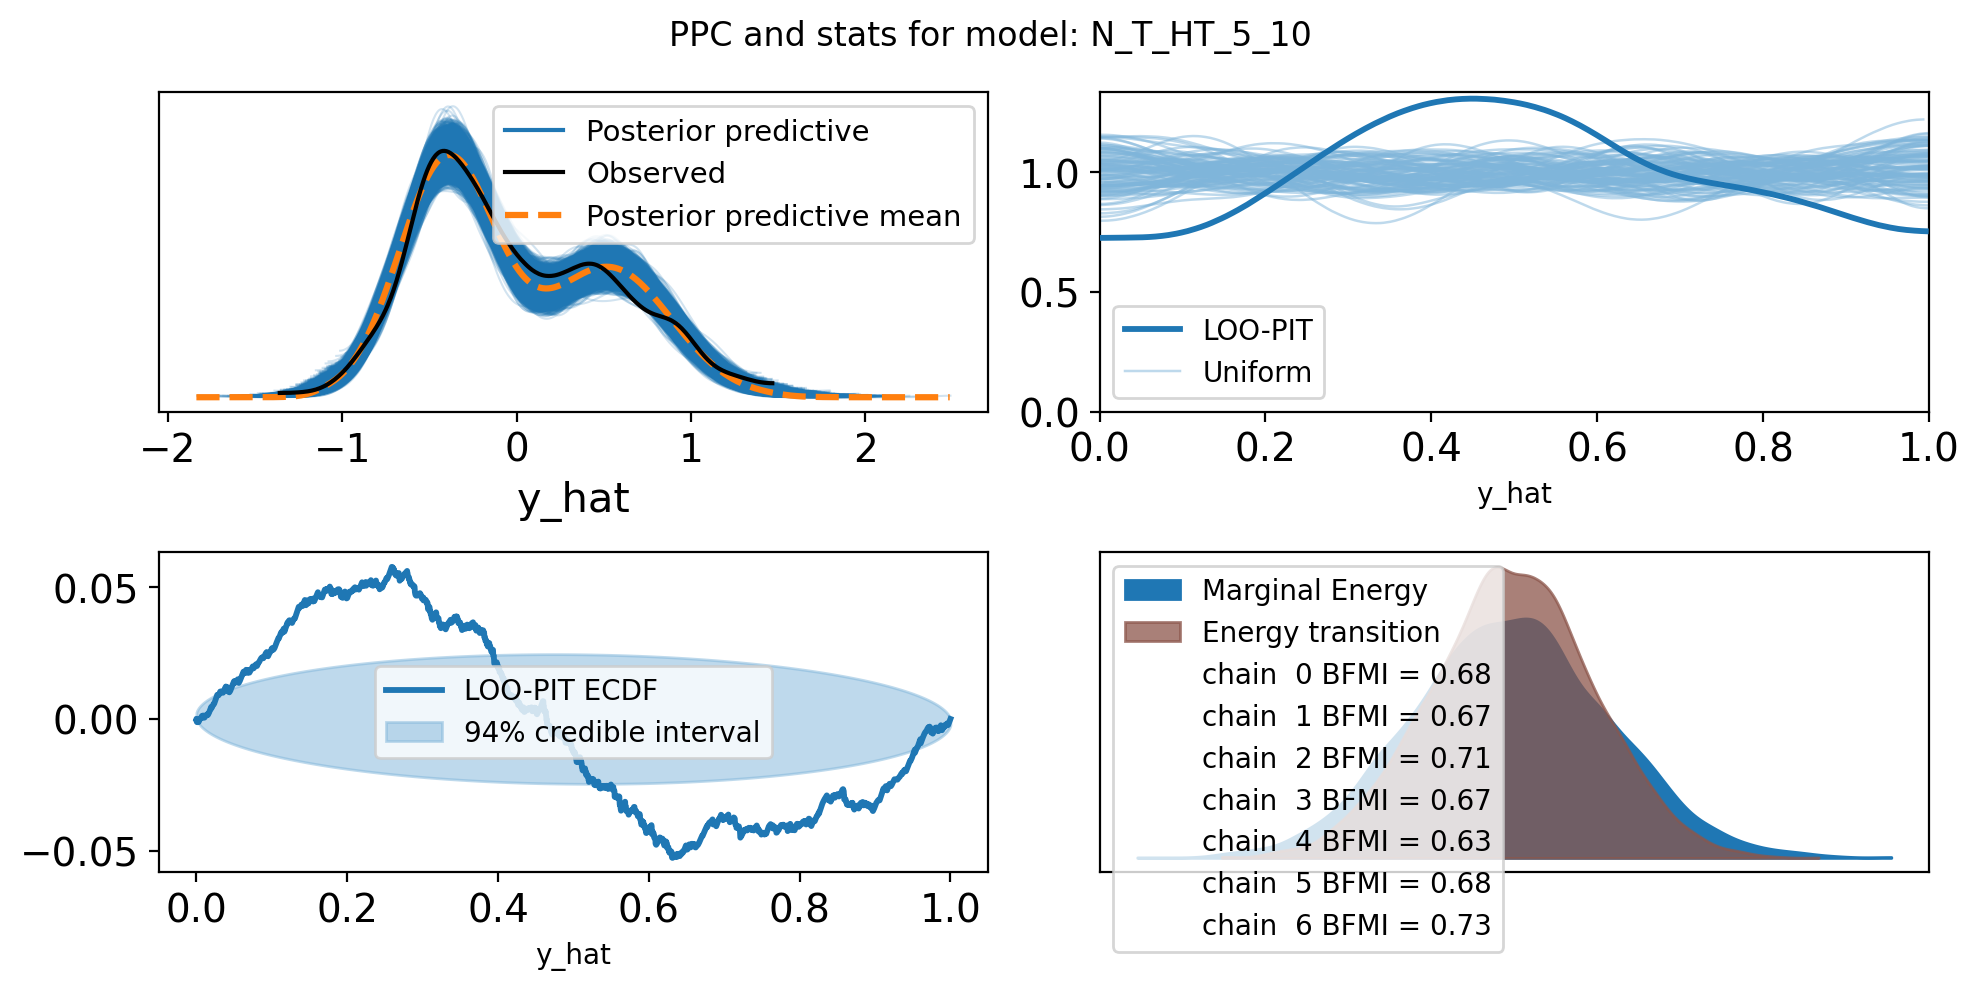
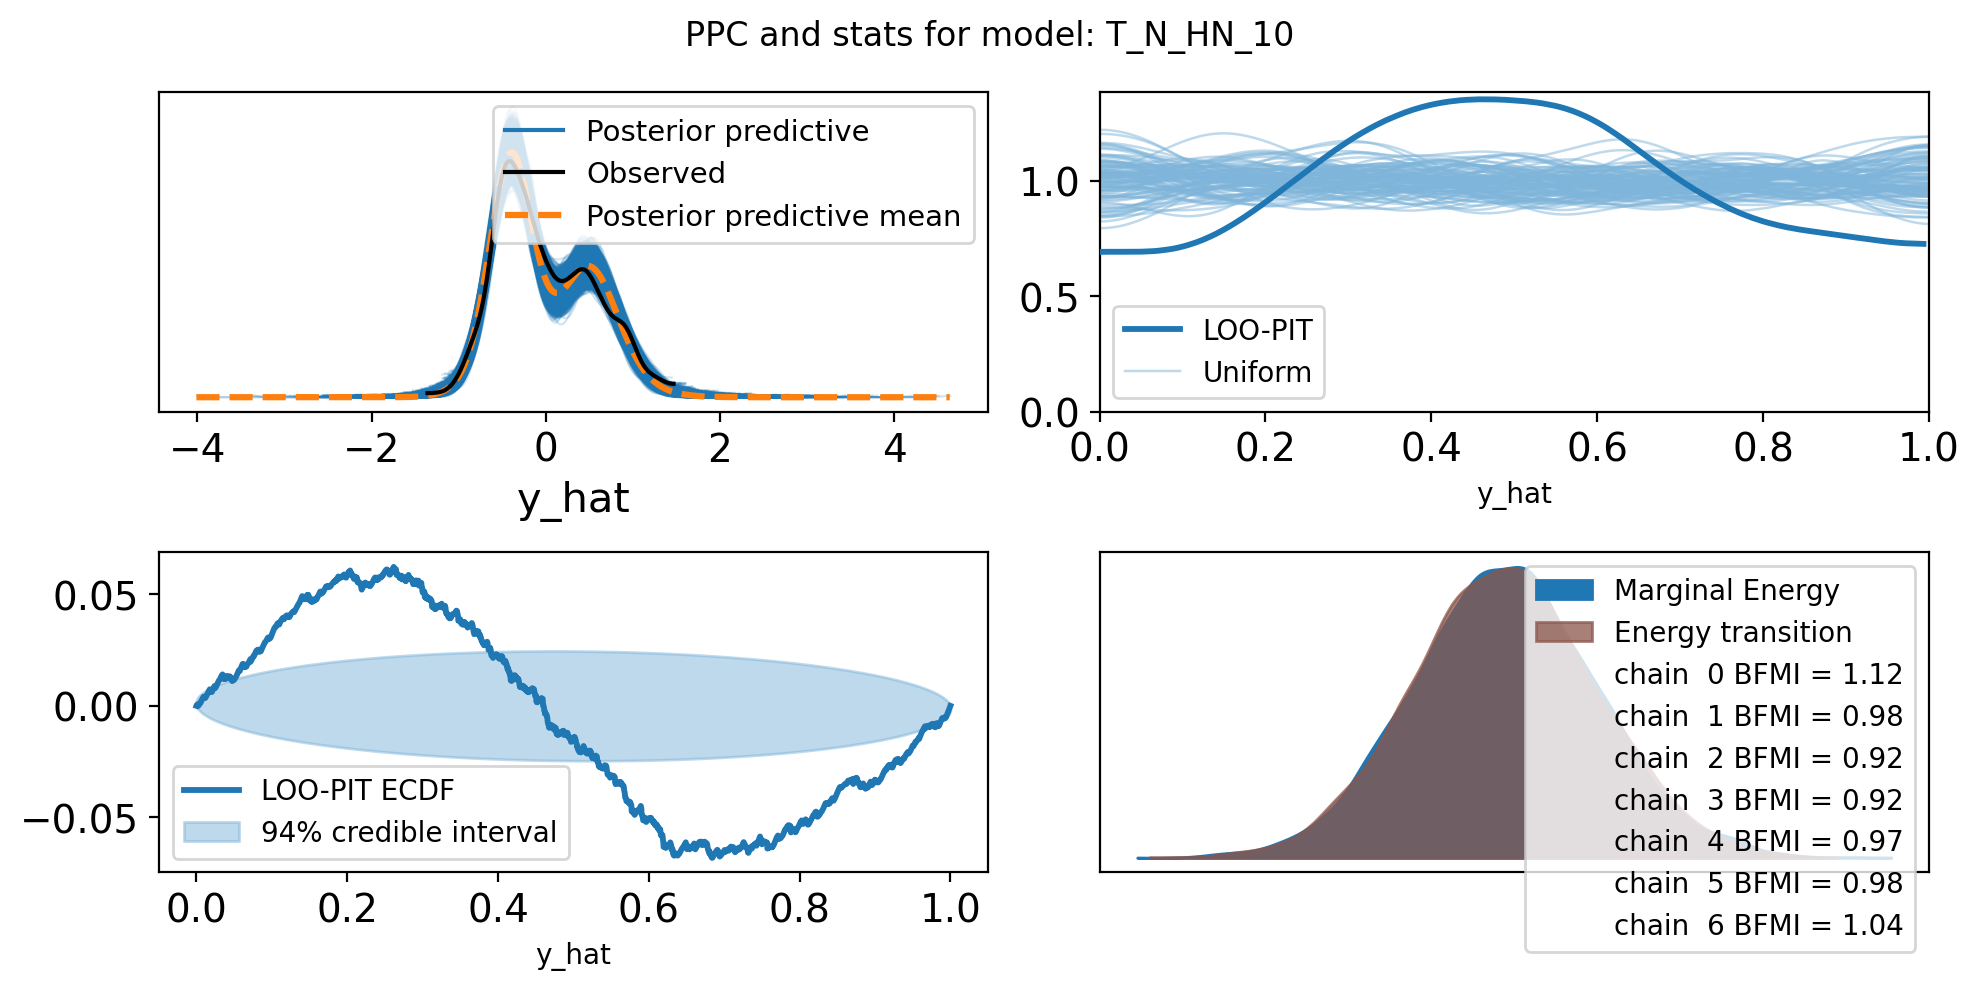
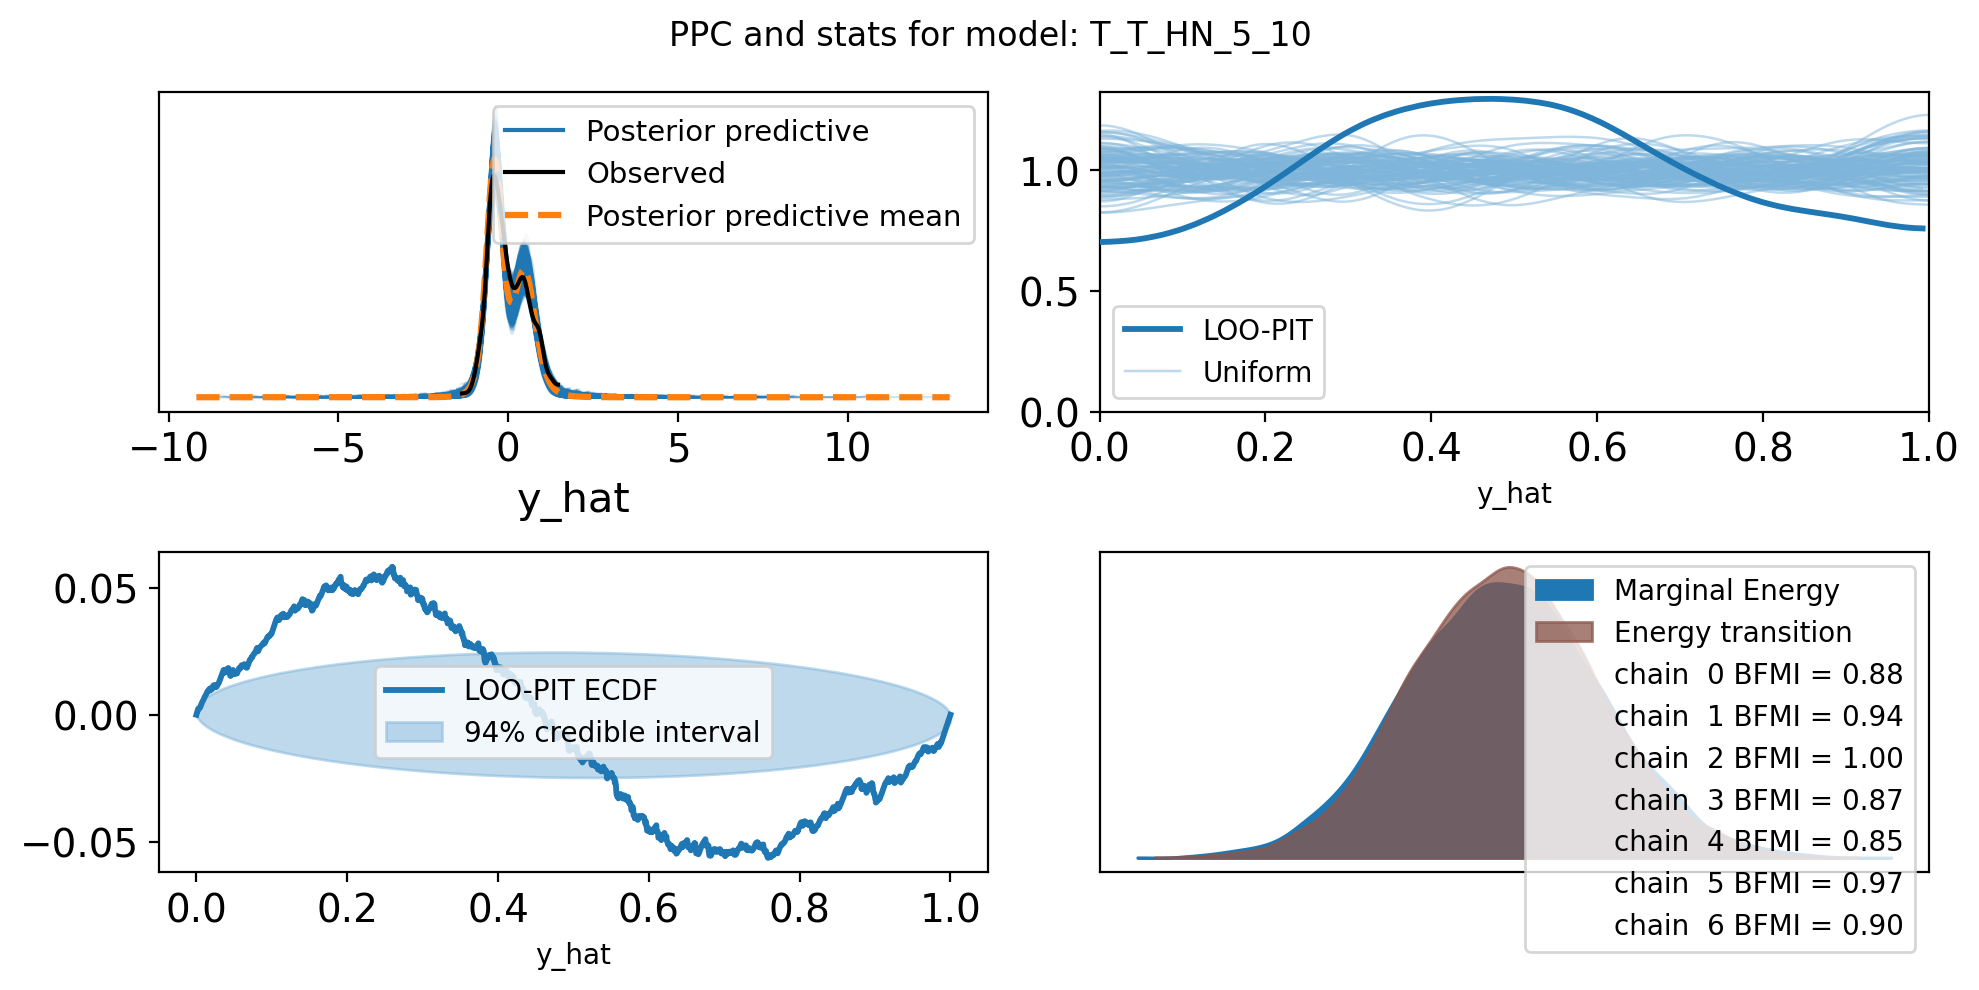
f,axs = plt.subplots(2, 2, figsize=(10, 5))
axs = axs.flatten()
az.plot_ppc(trace, var_names=["y_hat"], ax=axs[0])
az.plot_loo_pit(trace, y="y_hat", ax=axs[1])
az.plot_loo_pit(trace, y="y_hat", ax=axs[2], ecdf=True)
az.plot_energy(trace, ax = axs[3])
plt.suptitle(f"PPC and stats for model: {name}")
plt.tight_layout()/home/sojern/miniconda3/envs/pymc/lib/python3.13/site-packages/arviz/stats/stats.py:1045: RuntimeWarning: overflow encountered in exp
weights = 1 / np.exp(len_scale - len_scale[:, None]).sum(axis=1)
/home/sojern/miniconda3/envs/pymc/lib/python3.13/site-packages/numpy/_core/_methods.py:52: RuntimeWarning: overflow encountered in reduce
return umr_sum(a, axis, dtype, out, keepdims, initial, where)
/home/sojern/miniconda3/envs/pymc/lib/python3.13/site-packages/arviz/stats/stats.py:1045: RuntimeWarning: overflow encountered in exp
weights = 1 / np.exp(len_scale - len_scale[:, None]).sum(axis=1)
/home/sojern/miniconda3/envs/pymc/lib/python3.13/site-packages/numpy/_core/_methods.py:52: RuntimeWarning: overflow encountered in reduce
return umr_sum(a, axis, dtype, out, keepdims, initial, where)
/tmp/919963/ipykernel_2246972/245460086.py:25: UserWarning: Creating legend with loc="best" can be slow with large amounts of data.
plt.tight_layout()
/home/sojern/miniconda3/envs/pymc/lib/python3.13/site-packages/arviz/stats/stats.py:1045: RuntimeWarning: overflow encountered in exp
weights = 1 / np.exp(len_scale - len_scale[:, None]).sum(axis=1)
/home/sojern/miniconda3/envs/pymc/lib/python3.13/site-packages/numpy/_core/_methods.py:52: RuntimeWarning: overflow encountered in reduce
return umr_sum(a, axis, dtype, out, keepdims, initial, where)
/tmp/919963/ipykernel_2246972/245460086.py:25: UserWarning: Creating legend with loc="best" can be slow with large amounts of data.
plt.tight_layout()
/home/sojern/miniconda3/envs/pymc/lib/python3.13/site-packages/IPython/core/events.py:82: UserWarning: Creating legend with loc="best" can be slow with large amounts of data.
func(*args, **kwargs)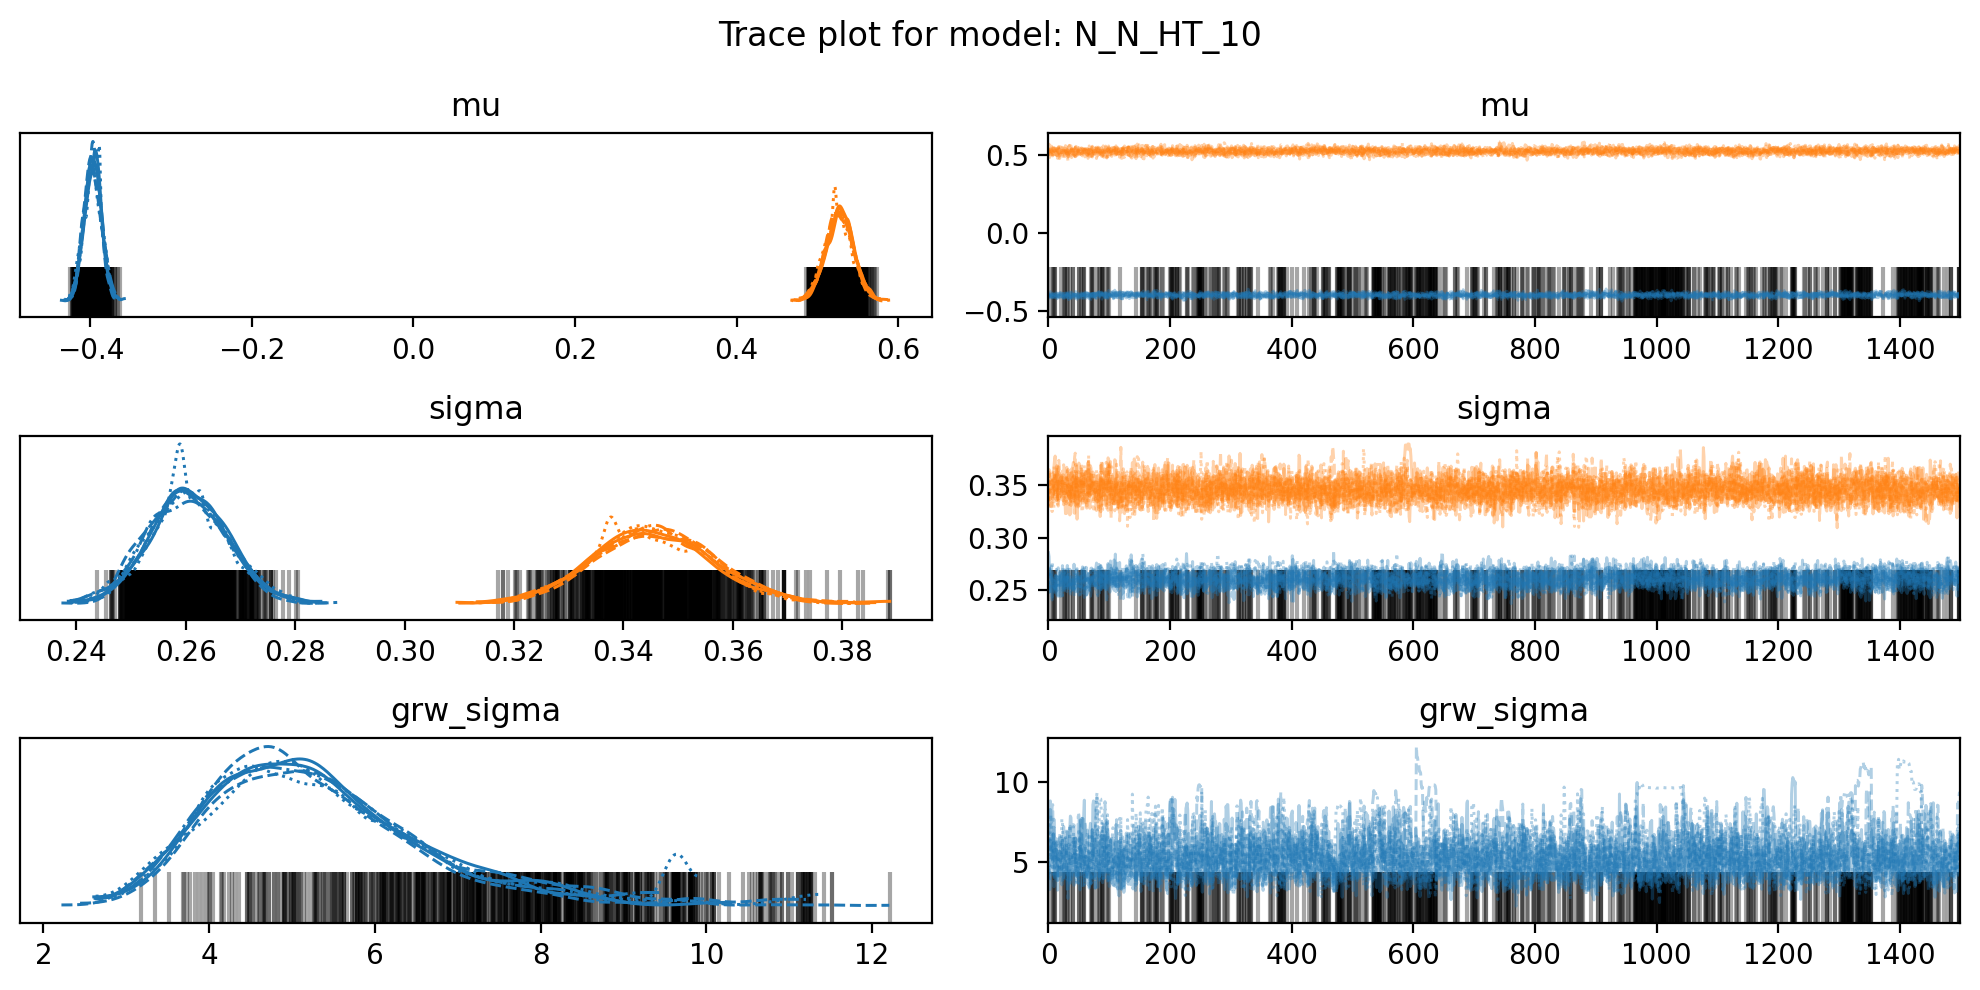
/home/sojern/miniconda3/envs/pymc/lib/python3.13/site-packages/IPython/core/pylabtools.py:170: UserWarning: Creating legend with loc="best" can be slow with large amounts of data.
  fig.canvas.print_figure(bytes_io, **kw)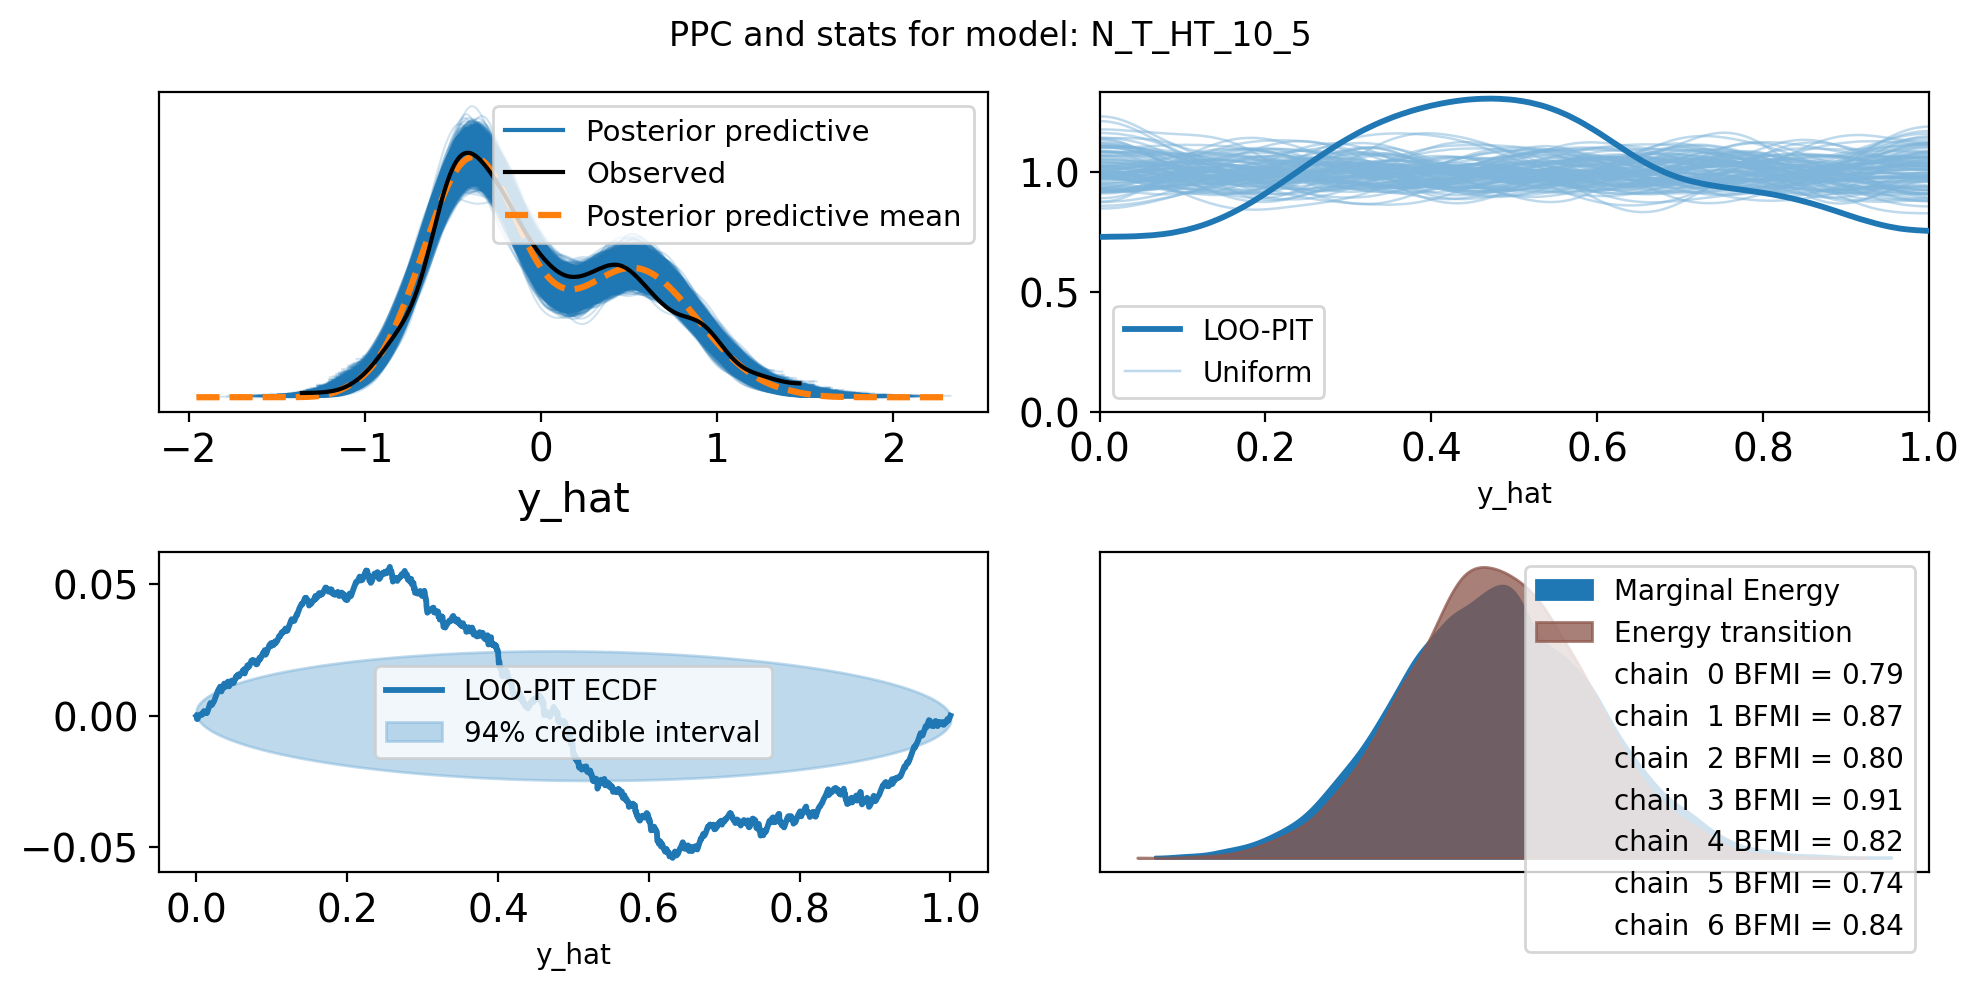


Save the models and traces
import os.path as op
import os
import cloudpickle

# Save the traces to file (netcdf)

dir = "../results"

for name, d in model_traces.items():
    name = name+ "_z"
    # Save the model.Model as a cloudpickle.dumps
    os.makedirs(op.join(dir, "models"), exist_ok=True)
    model_path = op.join(dir, "models", f"{name}_model.pkl")
    # print(model_path)
    with open(model_path, "wb") as f:
        cloudpickle.dump(d['model'], f)

    # Save the trace as a netcdf file
    trace_path = op.join(dir, "traces", f"{name}_trace.nc")
    os.makedirs(op.dirname(trace_path), exist_ok=True)
    az.to_netcdf(d['trace'], trace_path)