Open2C pipeline

pairtools: Convert sequencing data to a list of contacts

Check out the bamfiles

%%bash 

cd ../steps/bowtie2/local/bamfiles

samtools view SRR6502335_1.bam | head -n1
SRR6502335.1    16  chr2    194419849   44  149M1S  *   0   0   AGAGAGAAAGAGTAGAAGGGAGAAACAAAGGGCAGGAGAGGGGATAGATGAAGAGGAACTAGACTTTGCACATATTGGCTGGCAATGATGGAATAGTCCAGTTTCAAAGAGTGAGATCTTGTAGTTATCTTCTCATTTATTCACTTAATN  <FFAF-J7AJJA7AFA77-<AAF-7-A7-7A7-FJ<FA7FAA-7--AAA--<<A7FFJAJJJA<-A-F7F7<-A<F7---<A<JJFFAAF7JFAAJ<FFJF-<-FJJFFFFFJFAF<<-AJJJJJFFF-JFJFFJF7AFJFFFAA-AAA#  AS:i:285    XN:i:0  XM:i:2  XO:i:0  XG:i:0  NM:i:2  MD:Z:44G78A25   YT:Z:UU
%%bash 

cd ../steps/bowtie2/local/bamfiles/paired

samtools view SRR6502335_paired.bam | head -n1
SRR6502335.1    0   chr2    194419717   44  10S140M *   0   0   NTTCTGGATCGATCATTTTTACATTATTTTTGCCTATGAACCAACTTTCAAAATTATTTCTCGTTTAAAATACAATTCAATGAGGTATTCATTTTTGTCTGGGGGGAAAGATGGAAGGTAGGAAGAAGAAAGAAGTGAAGAAAGAGAGAA  #AAAFAF<JJJJJJFJJJJJJJ-JJFJJJJJ<JAA-FF-FFAAFJFJFJJ--7<F-AJFFAJFFFJF-7FF-FJF<FFJFJFFF<JA<AJA7<AJ<AJFJ<---77-7--7-7<AAFFAF77<FJ-<<--7-AFJ---7AF<AAF--7<7  AS:i:275    XN:i:0  XM:i:1  XO:i:0  XG:i:0  NM:i:1  MD:Z:125G14 YT:Z:UU

I had to decompress the reference genome

To make samtools faidx work (or compress with bgzip, not gunzip)

%%bash 

cd /home/sojern/hic-spermatogenesis/data/macaque_raw/ucsc_ref

gunzip -k rheMac10.fa.gz

Pair and sort the bamfiles (workfflow) - turned out not to work (no mapped reads were left after filtering)

from IPython.display import display, Markdown

# Read the content of the Python file
with open('../gwf_pair_alignments.py', 'r') as file:
    file_content = file.read()

# Display the content as Markdown
display(Markdown(f"```python\n{file_content}\n```"))
# %% [markdown]
# ---
# title: "gwf_bowtie_local"
# author: Søren Jørgensen
# date: last-modified
# execute: 
#   enabled: false
# ---

# %%
from gwf import *
import glob
import os.path as op

#######################################
#
# GWF workflow to pair alignments from mate-pair sequencing, after mapping to the reference individually.
# After mapping, the mate-pairs are merged with `samtools merge` (another workflow) and then parsed with `pairtools parse`. 
#
# How to run:
# conda activate gwf
# gwf -f gwf_gwf_pair_alignments.py status
#
# Workflow:
#   1   pairtools parse : Parse the fastq files into pairs (after merging with `samtools merge`)
#
# Footnote: always activate the conda environment before running the workflow:
# source $(conda info --base)/etc/profile.d/conda.sh
# conda activate env_name
#######################################

# Create a workflow object
gwf = Workflow(defaults={'nodes': 1, 'queue':"normal", 'account':"hic-spermatogenesis"})

#############################################
############### Templates ###################
#############################################

def pair_sort_alignments(chromsizes, bam_merged, sorted_pairs):
    """Pair the merged alignments from mate-pair sequencing with `pairtools parse`"""
    inputs = [bam_merged]
    outputs = [f"{bam_merged}_parsed.stats", 
               sorted_pairs]
    options = {'cores':12, 'memory':"4g", 'walltime':"01:00:00"}
    spec=f"""
source $(conda info --base)/etc/profile.d/conda.sh
conda activate hic
pairtools parse \
    -c {chromsizes} \
    --drop-sam --drop-seq \
    --output-stats {bam_merged}_parsed.stats \
    --add-columns mapq \
    --assembly rheMac10 --no-flip \
    --walks-policy mask \
    {bam_merged} | \
pairtools sort -o {sorted_pairs} 
"""
    return AnonymousTarget(inputs=inputs, outputs=outputs, options=options, spec=spec)

def dedup(sorted_pairs, ):
    """Deduplicate the sorted pairs with `pairtools dedup`"""

    pairs_prefix = sorted_pairs.split(".sorted")[0]
    inputs = [sorted_pairs]
    outputs = [f"{pairs_prefix}.nodups.pairs.gz",
               f"{pairs_prefix}.nodups.bam",
               f"{pairs_prefix}.unmapped.pairs.gz",
               f"{pairs_prefix}.unmapped.bam",
               f"{pairs_prefix}.dups.pairs.gz",
               f"{pairs_prefix}.dups.bam",
               f"{pairs_prefix}.dedup.stats"]
    options = {'cores':12, 'memory': "4g", 'walltime': "01:00:00"}
    spec = f"""
source $(conda info --base)/etc/profile.d/conda.sh
conda activate hic
pairtools dedup \
    --max-mismatch 3 \
    --mark-dups \
    --output \
        >(pairtools split \
            --output-pairs {pairs_prefix}.nodups.pairs.gz \
            --output-sam {pairs_prefix}.nodups.bam \
         ) \
    --output-unmapped \
        >( pairtools split \
            --output-pairs {pairs_prefix}.unmapped.pairs.gz \
            --output-sam {pairs_prefix}.unmapped.bam \
         ) \
    --output-dups \
        >( pairtools split \
            --output-pairs {pairs_prefix}.dups.pairs.gz \
            --output-sam {pairs_prefix}.dups.bam \
            ) \
    --output-stats {pairs_prefix}.dedup.stats \
    {sorted_pairs}

    """
    return AnonymousTarget(inputs=inputs, outputs=outputs, options=options, spec=spec)


#############################################
################ Targets ####################
#############################################

# Define the chromsizes file
chromsizes = "data/links/ucsc_ref/misc/rheMac10.chrom.sizes"

# Find the merged bam files
merged_bams = gwf.glob("steps/bowtie2/local/bamfiles/paired/*_paired.bam")

sorted_bams = sorted(merged_bams)


for inbam in sorted_bams:
    base = op.basename(inbam)
    prefix = base.split("_paired")[0]
    
    outdir = "steps/bowtie2/local/bamfiles/paired/"
    outfile = f"{base.split("_paired")[0]}" + ".sorted.pairs.gz"
    out_sorted_pairs = op.join(outdir, outfile)

    gwf.target_from_template(f"pair_sort_{prefix}",
                            pair_sort_alignments(chromsizes, inbam, out_sorted_pairs))
    
    gwf.target_from_template(f"dedup_{prefix}",
                            dedup(out_sorted_pairs))

Map the reads again but as PE reads in stead (cooler recommendation, workflow)

from IPython.display import display, Markdown

# Read the content of the Python file
with open('../gwf_bwamem.py', 'r') as file:
    file_content = file.read()

# Display the content as Markdown
display(Markdown(f"```python\n{file_content}\n```"))
# %% [markdown]
# ---
# title: "gwf_map_reads"
# author: Søren Jørgensen
# date: last-modified
# execute: 
#   enabled: false
# ---

# %%
from gwf import *
import glob
import os

#######################################
#
# GWF workflow to map Hi-C reads to pairs with `bwa` and `samtools`.
# Pairs are generated with `pairtools parse` and deduplicated with `pairtools dedup`.
#
# How to run:
# conda activate gwf
# gwf -f gwf_bwamem.py status
#
# Workflow:
#   1a bwa_index        : [Reference genome] Index the reference genome with `bwa index`
#   1b sam_index        : [Reference genome] Index the fasta again with `samtools faidx``
#   2  bwa_map          : Map reads (PE) to the reference with `bwa mem` 
#   3  pair_sort        : Pair the merged alignments from mate-pair sequencing with `pairtools parse`, 
#                         then sort with `pairtools sort`
#   4  dedup            : Deduplicate the sorted pairs with `pairtools dedup`  
#
#######################################

# Create a workflow object
gwf = Workflow(defaults={'nodes': 1, 'queue':"normal", 'account':"hic-spermatogenesis"})

#############################################
############### Templates ###################
#############################################

def bwa_index(ref_genome):
    """Template for indexing the reference genome with bwa"""
    inputs  = [ref_genome]
    outputs = [f"{ref_genome}.amb", 
               f"{ref_genome}.ann", 
               f"{ref_genome}.bwt", 
               f"{ref_genome}.pac", 
               f"{ref_genome}.sa"]
    options = {'cores':1, 'memory': "5g", 'walltime':"02:00:00"}
    spec = f'''
source $(conda info --base)/etc/profile.d/conda.sh
conda activate hic
bwa index -p {ref_genome} -a bwtsw {ref_genome}
'''
    return AnonymousTarget(inputs=inputs, outputs=outputs, options=options, spec=spec)

def sam_index(ref_genome):
    """Creating a Fasta index. `bwa mem` also needs a fasta index generated by samtools"""
    inputs = [ref_genome]
    outputs = [f"{ref_genome}.fai"]
    options = {'cores':1, 'memory':"5g", 'walltime':"00:20:00"}
    spec=f"""
source $(conda info --base)/etc/profile.d/conda.sh
conda activate hic
samtools faidx {ref_genome}
"""
    return AnonymousTarget(inputs=inputs, outputs=outputs, options=options, spec=spec)


def bwa_map(ref_genome, mate_1, mate_2, out_bam):
    """
    Template for mapping reads to a reference genome using `bwa` and `samtools`. 
    NB! Here, we map the mates together, as bwa states it is no problem for Hi-C reads. 
    """
    threads = 32
    inputs = [f"{ref_genome}.amb", 
              f"{ref_genome}.ann", 
              f"{ref_genome}.bwt", 
              f"{ref_genome}.pac", 
              f"{ref_genome}.sa", 
              f"{ref_genome}.fai",
              mate_1, mate_2]
    outputs = [out_bam]
    options = {'cores':threads, 'memory': "32g", 'walltime':"06:00:00"}
    spec = f"""
source $(conda info --base)/etc/profile.d/conda.sh
conda activate hic
bwa mem -t {threads} -SP {ref_genome} {mate_1} {mate_2} > {out_bam}
"""
    return AnonymousTarget(inputs=inputs, outputs=outputs, options=options, spec=spec)

def pair_sort_alignments(chromsizes, bam_merged, sorted_pairs):
    """Pair the merged alignments from mate-pair sequencing with `pairtools parse`"""
    inputs = [bam_merged]
    outputs = [f"{bam_merged}_parsed.stats", 
               sorted_pairs]
    options = {'cores':12, 'memory':"4g", 'walltime':"02:00:00"}
    spec=f"""
source $(conda info --base)/etc/profile.d/conda.sh
conda activate hic
pairtools parse \
    -c {chromsizes} \
    --drop-sam --drop-seq \
    --output-stats {bam_merged}_parsed.stats \
    --add-columns mapq \
    --assembly rheMac10 --no-flip \
    --walks-policy mask \
    {bam_merged} | \
pairtools sort -o {sorted_pairs} 
"""
    return AnonymousTarget(inputs=inputs, outputs=outputs, options=options, spec=spec)

def dedup(sorted_pairs):
    """Deduplicate the sorted pairs with `pairtools dedup`"""
    pairs_prefix = sorted_pairs.split(".sorted")[0]
    inputs = [sorted_pairs]
    outputs = [f"{pairs_prefix}.nodups.pairs.gz",
               f"{pairs_prefix}.nodups.bam",
               f"{pairs_prefix}.unmapped.pairs.gz",
               f"{pairs_prefix}.unmapped.bam",
               f"{pairs_prefix}.dups.pairs.gz",
               f"{pairs_prefix}.dups.bam",
               f"{pairs_prefix}.dedup.stats"]
    options = {'cores':12, 'memory': "4g", 'walltime': "01:00:00"}
    spec = f"""
source $(conda info --base)/etc/profile.d/conda.sh
conda activate hic
pairtools dedup \
    --max-mismatch 3 \
    --mark-dups \
    --output \
        >(pairtools split \
            --output-pairs {pairs_prefix}.nodups.pairs.gz \
            --output-sam {pairs_prefix}.nodups.bam \
         ) \
    --output-unmapped \
        >( pairtools split \
            --output-pairs {pairs_prefix}.unmapped.pairs.gz \
            --output-sam {pairs_prefix}.unmapped.bam \
         ) \
    --output-dups \
        >( pairtools split \
            --output-pairs {pairs_prefix}.dups.pairs.gz \
            --output-sam {pairs_prefix}.dups.bam \
            ) \
    --output-stats {pairs_prefix}.dedup.stats \
    {sorted_pairs}

    """
    return AnonymousTarget(inputs=inputs, outputs=outputs, options=options, spec=spec)


#############################################
############### Create targets ##############
#############################################

# Do stuff with the [unpacked] reference genome
ref_genome = "data/links/ucsc_ref/rheMac10.fa"

T1a = gwf.target_from_template(f"bwa_index_{os.path.basename(ref_genome)}", 
                               bwa_index(ref_genome=ref_genome))
T1b = gwf.target_from_template(f"sam_index_{os.path.basename(ref_genome)}", 
                               sam_index(ref_genome=ref_genome))


# Define the chromsizes file
chromsizes = "data/links/ucsc_ref/misc/rheMac10.chrom.sizes"


# Locate Hi-C reads 
fastq_folder = "data/links/macaque_fastq/"
fastq_files = glob.glob(os.path.join(fastq_folder, "*.fastq.gz"))

# Pair the files (make sure they have the same base name prefix):
fastq_files.sort()
paired_fastq_files = list(zip(fastq_files[::2], fastq_files[1::2]))

for f1,f2 in paired_fastq_files:
    
    # Get the base names
    basename_1 = os.path.basename(f1).split('.fast')[0]
    basename_2 = os.path.basename(f2).split('.fast')[0]
    
    # Combine pair names
    pairname = os.path.commonprefix([basename_1, basename_2]).split('_')[0]

    # Create the output bam filenames
    bam_dir = f"steps/bwa/PE/bamfiles/"
    bam_file = pairname + ".PE.bam"
    out_bam = os.path.join(bam_dir, bam_file)

    # Create targets for mapping
    T2 = gwf.target_from_template(f"bwa_map_{pairname}", 
                                  bwa_map(ref_genome=ref_genome, 
                                          mate_1=f1, mate_2=f2, 
                                          out_bam=out_bam))
    
    # Create targets for sorting the pairs
    pair_dir = "steps/bwa/PE/pairs/"
    pair_file = pairname + ".sorted.pairs.gz"
    sorted_pairs = os.path.join(pair_dir, pair_file)

    T3 = gwf.target_from_template(f"pair_sort_{pairname}", 
                                  pair_sort_alignments(chromsizes=chromsizes, 
                                                       bam_merged=out_bam, 
                                                       sorted_pairs=sorted_pairs))
    
    T4 = gwf.target_from_template(f"dedup_{pairname}", dedup(sorted_pairs=sorted_pairs))


Check the sorted pairs

%%bash

#cd ../steps/bowtie2/local/bamfiles/paired
cd ../steps/bwa/PE/pairs

# Unique pairs:
gzip -dc SRR6502339.nodups.pairs.gz | grep -v '#' |  head -n 5

echo "--"

# Only dups
gzip -dc SRR6502339.dups.pairs.gz | grep -v '#' |  head -n 5

echo "--"
SRR6502339.38272510 chr1    898 chr1    1026    +   -   UU  3   3
SRR6502339.13727657 chr1    976 chr1    175669579   +   -   UR  4   60
SRR6502339.67930411 chr1    1035    chr1    99209   +   -   UU  22  60
SRR6502339.90172213 chr1    1134    chr1    11385306    -   +   UR  9   60
SRR6502339.53849219 chr1    5186    chr1    56858619    +   -   UR  2   60
--
SRR6502339.53849978 chr1    5186    chr1    56858619    +   -   DD  2   60
SRR6502339.67632192 chr1    13335   chr1    370581  +   -   DD  3   7
SRR6502339.92006828 chr1    16215   chr1    16560   +   -   DD  35  12
SRR6502339.71065550 chr1    19644   chr1    62483   +   -   DD  23  60
SRR6502339.89600080 chr1    19644   chr1    62483   +   -   DD  25  60
--
[main_samview] fail to read the header from "SRR6502339.nodups.bam".

Visualize Stats: pairtools stats

It might be the same stats that are (optionally) returned from pairtools parse.

Let’s look at the parsed stats in a nice way:

If it is not the same, then run this command on all the sorted pairs.

%%bash 

cd ../steps/bwa/PE/pairs

#pairtools stats SRR6502339.sorted.pairs.gz -o test.stats

Otherwise, just use MultiQC

Generate the MultiQC files

Now visualize:

All results merged (before dedup)
from IPython.display import IFrame

IFrame(src='../steps/bwa/PE/bamfiles/fibroblast/Fibroblasts_all_multiqc_report.html', width=1200, height=800)
%%bash 

cd ../steps/bwa/PE/pairs/

multiqc -i Fibroblasts_all.dedup --no-data-dir  *.stats 

/// d=807531;https://multiqc.info\MultiQC;;\ 🔍 v1.25.1

     update_config | Report title: Fibroblasts_all.dedup
       file_search | Search path: /faststorage/project/hic-spermatogenesis/people/sojern/hic-spermatogenesis/steps/bwa/PE/pairs/SRR6502335.dedup.stats
       file_search | Search path: /faststorage/project/hic-spermatogenesis/people/sojern/hic-spermatogenesis/steps/bwa/PE/pairs/SRR6502336.dedup.stats
       file_search | Search path: /faststorage/project/hic-spermatogenesis/people/sojern/hic-spermatogenesis/steps/bwa/PE/pairs/SRR6502337.dedup.stats
       file_search | Search path: /faststorage/project/hic-spermatogenesis/people/sojern/hic-spermatogenesis/steps/bwa/PE/pairs/SRR6502338.dedup.stats
       file_search | Search path: /faststorage/project/hic-spermatogenesis/people/sojern/hic-spermatogenesis/steps/bwa/PE/pairs/SRR6502339.dedup.stats
         searching | ━━━━━━━━━━━━━━━━━━━━━━━━━━━━━━━━━━━━━━━━ 100% 5/5  .dedup.statsmSRR6502338.dedup.stats
         pairtools | Found 5 reports
     write_results | Data        : None
     write_results | Report      : Fibroblasts_all.dedup_multiqc_report.html
           multiqc | MultiQC complete
from IPython.display import IFrame

IFrame(src='../data/QC/Fibroblasts_all.dedup_multiqc_report.html', width=1200, height=800)

Dedup the pairs and visualize stats again

The pairs was deduplicated with a gwf workflow gwf_bwamem.py

%%bash 

cd ../steps/bwa/PE/pairs/sorted

multiqc -i fibroblast.dedup --no-data-dir *.stats

/// d=271458;https://multiqc.info\MultiQC;;\ 🔍 v1.25.1

     update_config | Report title: fibroblast.dedup
       file_search | Search path: /faststorage/project/hic-spermatogenesis/people/sojern/hic-spermatogenesis/steps/bwa/PE/pairs/sorted/SRR6502335.dedup.stats
       file_search | Search path: /faststorage/project/hic-spermatogenesis/people/sojern/hic-spermatogenesis/steps/bwa/PE/pairs/sorted/SRR6502336.dedup.stats
       file_search | Search path: /faststorage/project/hic-spermatogenesis/people/sojern/hic-spermatogenesis/steps/bwa/PE/pairs/sorted/SRR6502337.dedup.stats
       file_search | Search path: /faststorage/project/hic-spermatogenesis/people/sojern/hic-spermatogenesis/steps/bwa/PE/pairs/sorted/SRR6502338.dedup.stats
       file_search | Search path: /faststorage/project/hic-spermatogenesis/people/sojern/hic-spermatogenesis/steps/bwa/PE/pairs/sorted/SRR6502339.dedup.stats
         searching | ━━━━━━━━━━━━━━━━━━━━━━━━━━━━━━━━━━━━━━━━ 100% 5/5  0/5  
         pairtools | Found 5 reports
     write_results | Data        : None
     write_results | Report      : fibroblast.dedup_multiqc_report.html
           multiqc | MultiQC complete
from IPython.display import IFrame

IFrame(src='../data/QC/fibroblast.dedup_multiqc_report.html', width=1200, height=800, style="border:2px solid black")

cooler: Make the pairs cool

%%bash 

# Filter the chromsizes to only include the placed scaffolds

echo "Lines in unfiltered chrom.sizes:" $(cat ../data/links/ucsc_ref/misc/rheMac10.chrom.sizes | grep -c "")

cat ../data/links/ucsc_ref/misc/rheMac10.chrom.sizes | grep -Pv "^chrUn|^chrM|_random" | sort -V > ../data/links/ucsc_ref/misc/rheMac10.filtered.chrom.sizes

echo "New filtered.chrom.sizes:"
cat ../data/links/ucsc_ref/misc/rheMac10.filtered.chrom.sizes
Lines in unfiltered chrom.sizes: 2939
New filtered.chrom.sizes:
chr1    223616942
chr2    196197964
chr3    185288947
chr4    169963040
chr5    187317192
chr6    179085566
chr7    169868564
chr8    145679320
chr9    134124166
chr10   99517758
chr11   133066086
chr12   130043856
chr13   108737130
chr14   128056306
chr15   113283604
chr16   79627064
chr17   95433459
chr18   74474043
chr19   58315233
chr20   77137495
chrX    153388924
chrY    11753682
%%bash

cd ../steps/bwa/PE/pairs/sorted/

echo $PWD 

du -ha SRR650233*.gz
/faststorage/project/hic-spermatogenesis/people/sojern/hic-spermatogenesis/steps/bwa/PE/pairs/sorted \n
287M    SRR6502335.dups.pairs.gz
1.8G    SRR6502335.nodups.pairs.gz
2.7G    SRR6502335.sorted.pairs.gz
722M    SRR6502335.unmapped.pairs.gz
323M    SRR6502336.dups.pairs.gz
1.6G    SRR6502336.nodups.pairs.gz
2.3G    SRR6502336.sorted.pairs.gz
621M    SRR6502336.unmapped.pairs.gz
190M    SRR6502337.dups.pairs.gz
1.3G    SRR6502337.nodups.pairs.gz
1.9G    SRR6502337.sorted.pairs.gz
528M    SRR6502337.unmapped.pairs.gz
131M    SRR6502338.dups.pairs.gz
1.4G    SRR6502338.nodups.pairs.gz
2.0G    SRR6502338.sorted.pairs.gz
512M    SRR6502338.unmapped.pairs.gz
150M    SRR6502339.dups.pairs.gz
667M    SRR6502339.nodups.pairs.gz
1.1G    SRR6502339.sorted.pairs.gz
274M    SRR6502339.unmapped.pairs.gz
%%bash

ref=../data/links/ucsc_ref/misc/rheMac10.chrom.sizes

for INFILE in ../steps/bwa/PE/pairs/sorted/*.nodups*; do
    base=$(basename $INFILE .pairs.gz)
    outfile=../steps/bwa/PE/pairs/cool/$base.10000.cool
    
    echo $base '-->' $outfile

    cooler cload pairs \
    -c1 2 -p1 3 -c2 4 -p2 5 \
    --assembly rheMac10 \
    --chunksize 50000 \
    $ref:10000 \
    $INFILE \
    $outfile &
    
done 

wait

cooler: access and plot Hi-C data

Introduction

First, we have to check the data output from HiCExplorer. The output is a .cool file, which is a binary format for storing Hi-C data. The file contains the binned contact matrix and the genomic coordinates of the bins.

The cooler package is a Python library for working with .cool files. It provides tools for reading, writing, and manipulating Hi-C data. The cooltools package is a collection of tools for analyzing Hi-C data, including normalization, visualization, and interaction calling.

Follow cooler walkthrough from the documentation

# Import the packages we will use
import os.path as op
import matplotlib.pyplot as plt
import numpy as np
import pandas
import h5py

import cooler
# The following directive activates inline plotting
%matplotlib inline
# Define the filepath (I choose the uncorrected matrix)

filepath = "../steps/bowtie2/local/matrices/filtered_pooled_10kb.cool"

Direct access with h5py

h5 = h5py.File(filepath, 'r')
h5
<HDF5 file "filtered_pooled_10kb.cool" (mode r)>
h5.keys()
<KeysViewHDF5 ['bins', 'chroms', 'indexes', 'pixels']>
h5['pixels']
<HDF5 group "/pixels" (3 members)>
list(h5['pixels'].keys())
['bin1_id', 'bin2_id', 'count']

h5py dataset objects are views onto the data on disk

h5['pixels']['bin2_id']
<HDF5 dataset "bin2_id": shape (117090191,), type "<i4">

Slicing or indexing returns a numpy array in memory.

h5['pixels']['bin2_id'][:10]
array([   0,    9,   30,   33,  124,  127,  145,  756, 1167, 2416],
      dtype=int32)
h5['pixels']['count'][:10]
array([1., 1., 1., 1., 1., 1., 1., 1., 1., 1.])
h5.close()

The Python cooler package is just a thin wrapper over h5py.

  • It lets you access the data tables as Pandas data frames and series.
  • It also provides a matrix abstraction: letting you query the upper triangle pixel table as if it were a full rectangular sparse matrix via SciPy.

The Cooler class

Accepts a file path or an open HDF5 file object.

NOTE: Using a filepath allows the Cooler object to be serialized/pickled since the file is only opened when needed

c = cooler.Cooler(filepath)
c.info
{'bin-size': 10000,
 'bin-type': 'fixed',
 'creation-date': '2024-09-24T21:20:38.656143',
 'format': 'HDF5::Cooler',
 'format-url': 'https://github.com/mirnylab/cooler',
 'format-version': 3,
 'generated-by': 'HiCMatrix-17.2',
 'generated-by-cooler-lib': 'cooler-0.10.2',
 'genome-assembly': 'unknown',
 'metadata': {'format': 'HDF5::Cooler',
  'format-url': 'https://github.com/mirnylab/cooler',
  'generated-by': 'HiCMatrix-17.2',
  'generated-by-cooler-lib': 'cooler-0.10.2',
  'tool-url': 'https://github.com/deeptools/HiCMatrix'},
 'nbins': 285406,
 'nchroms': 22,
 'nnz': 117090191,
 'storage-mode': 'symmetric-upper',
 'sum': 193589731.0,
 'tool-url': 'https://github.com/deeptools/HiCMatrix'}
c.chroms()
<cooler.core._selectors.RangeSelector1D at 0x146a5acf1cd0>

The return value is a selector or “view” on a table that accepts column and range queries (“slices”).

  • Column selections return a new view.
  • Range selections return pandas DataFrames or Series.
# Get a slice of the chromosomes
c.chroms()[0:5]

# Or the whole dict
#c.chroms()[:]
name length
0 chr1 223616942
1 chr2 196197964
2 chr3 185288947
3 chr4 169963040
4 chr5 187317192
# Convenience
c.chromnames, c.chromsizes
(['chr1',
  'chr2',
  'chr3',
  'chr4',
  'chr5',
  'chr6',
  'chr7',
  'chr8',
  'chr9',
  'chr10',
  'chr11',
  'chr12',
  'chr13',
  'chr14',
  'chr15',
  'chr16',
  'chr17',
  'chr18',
  'chr19',
  'chr20',
  'chrX',
  'chrY'],
 name
 chr1     223616942
 chr2     196197964
 chr3     185288947
 chr4     169963040
 chr5     187317192
 chr6     179085566
 chr7     169868564
 chr8     145679320
 chr9     134124166
 chr10     99517758
 chr11    133066086
 chr12    130043856
 chr13    108737130
 chr14    128056306
 chr15    113283604
 chr16     79627064
 chr17     95433459
 chr18     74474043
 chr19     58315233
 chr20     77137495
 chrX     153388924
 chrY      11753682
 Name: length, dtype: int32)
# Access bins
c.bins()[:10]
chrom start end
0 chr1 0 10000
1 chr1 10000 20000
2 chr1 20000 30000
3 chr1 30000 40000
4 chr1 40000 50000
5 chr1 50000 60000
6 chr1 60000 70000
7 chr1 70000 80000
8 chr1 80000 90000
9 chr1 90000 100000

Selecting a list of columns returns a new DataFrame view on that subset of columns

bins = c.bins()[['chrom', 'start', 'end']]
bins
<cooler.core._selectors.RangeSelector1D at 0x146a60464a40>
bins[:5]
chrom start end
0 chr1 0 10000
1 chr1 10000 20000
2 chr1 20000 30000
3 chr1 30000 40000
4 chr1 40000 50000

The pixel table contains the non-zero upper triangle entries of the contact map.

# Use the join=True option if you would like to expand the bin IDs into genomic bin coordinates by joining the output with the bin table.

display(c.pixels()[:10], c.pixels(join=True)[:10])
bin1_id bin2_id count
0 0 0 1.0
1 0 9 1.0
2 0 30 1.0
3 0 33 1.0
4 0 124 1.0
5 0 127 1.0
6 0 145 1.0
7 0 756 1.0
8 0 1167 1.0
9 0 2416 1.0
chrom1 start1 end1 chrom2 start2 end2 count
0 chr1 0 10000 chr1 0 10000 1.0
1 chr1 0 10000 chr1 90000 100000 1.0
2 chr1 0 10000 chr1 300000 310000 1.0
3 chr1 0 10000 chr1 330000 340000 1.0
4 chr1 0 10000 chr1 1240000 1250000 1.0
5 chr1 0 10000 chr1 1270000 1280000 1.0
6 chr1 0 10000 chr1 1450000 1460000 1.0
7 chr1 0 10000 chr1 7560000 7570000 1.0
8 chr1 0 10000 chr1 11670000 11680000 1.0
9 chr1 0 10000 chr1 24160000 24170000 1.0

Dump any table selection with pandas to tabular

df = c.pixels(join=True)[:100]

# df.to_csv('data/myselection.txt'), sep='\t', index=False, header=False) 

Bin annotation

Another way to annotate the bins in a data frame of pixels is to use cooler.annotate. It does a left outer join from the bin1_id and bin2_id columns onto a data frame indexed by bin ID that describes the bins.

bins = c.bins()[:] # fetch all
pix = c.pixels()[100:110] # select some pixels
pix
bin1_id bin2_id count
100 2 481 1.0
101 2 500 1.0
102 2 519 1.0
103 2 557 1.0
104 2 580 1.0
105 2 594 1.0
106 2 606 1.0
107 2 621 1.0
108 2 625 1.0
109 2 646 1.0
cooler.annotate(pix, bins)
chrom1 start1 end1 chrom2 start2 end2 bin1_id bin2_id count
100 chr1 20000 30000 chr1 4810000 4820000 2 481 1.0
101 chr1 20000 30000 chr1 5000000 5010000 2 500 1.0
102 chr1 20000 30000 chr1 5190000 5200000 2 519 1.0
103 chr1 20000 30000 chr1 5570000 5580000 2 557 1.0
104 chr1 20000 30000 chr1 5800000 5810000 2 580 1.0
105 chr1 20000 30000 chr1 5940000 5950000 2 594 1.0
106 chr1 20000 30000 chr1 6060000 6070000 2 606 1.0
107 chr1 20000 30000 chr1 6210000 6220000 2 621 1.0
108 chr1 20000 30000 chr1 6250000 6260000 2 625 1.0
109 chr1 20000 30000 chr1 6460000 6470000 2 646 1.0
cooler.annotate(pix, bins[['start']], replace=False)
start1 start2 bin1_id bin2_id count
100 20000 4810000 2 481 1.0
101 20000 5000000 2 500 1.0
102 20000 5190000 2 519 1.0
103 20000 5570000 2 557 1.0
104 20000 5800000 2 580 1.0
105 20000 5940000 2 594 1.0
106 20000 6060000 2 606 1.0
107 20000 6210000 2 621 1.0
108 20000 6250000 2 625 1.0
109 20000 6460000 2 646 1.0

Enter the Matrix

Finally, the matrix method provides a 2D-sliceable view on the data. It allows you to query the data on file as a full rectangular contact matrix.

c.matrix()
<cooler.core._selectors.RangeSelector2D at 0x146a5ad44470>
arr = c.matrix(balance=False)[1000:1200, 1000:1200]
arr
array([[ 57.,  33.,   9., ...,   0.,   1.,   0.],
       [ 33.,  88.,  33., ...,   1.,   0.,   0.],
       [  9.,  33.,  74., ...,   0.,   0.,   0.],
       ...,
       [  0.,   1.,   0., ..., 104.,  27.,  12.],
       [  1.,   0.,   0., ...,  27., 118.,  46.],
       [  0.,   0.,   0., ...,  12.,  46., 135.]])
# Use sparse=True to return a scipy.sparse.coo_matrix in stead

mat = c.matrix(balance=False, sparse=True)[1000:1200,1000:1200]
mat
<200x200 sparse matrix of type '<class 'numpy.float64'>'
    with 26544 stored elements in COOrdinate format>

Convert to a 2D numpy array

arr = mat.toarray()
arr
array([[ 57.,  33.,   9., ...,   0.,   1.,   0.],
       [ 33.,  88.,  33., ...,   1.,   0.,   0.],
       [  9.,  33.,  74., ...,   0.,   0.,   0.],
       ...,
       [  0.,   1.,   0., ..., 104.,  27.,  12.],
       [  1.,   0.,   0., ...,  27., 118.,  46.],
       [  0.,   0.,   0., ...,  12.,  46., 135.]])

Notice that tha lower triangle has automatically been filled

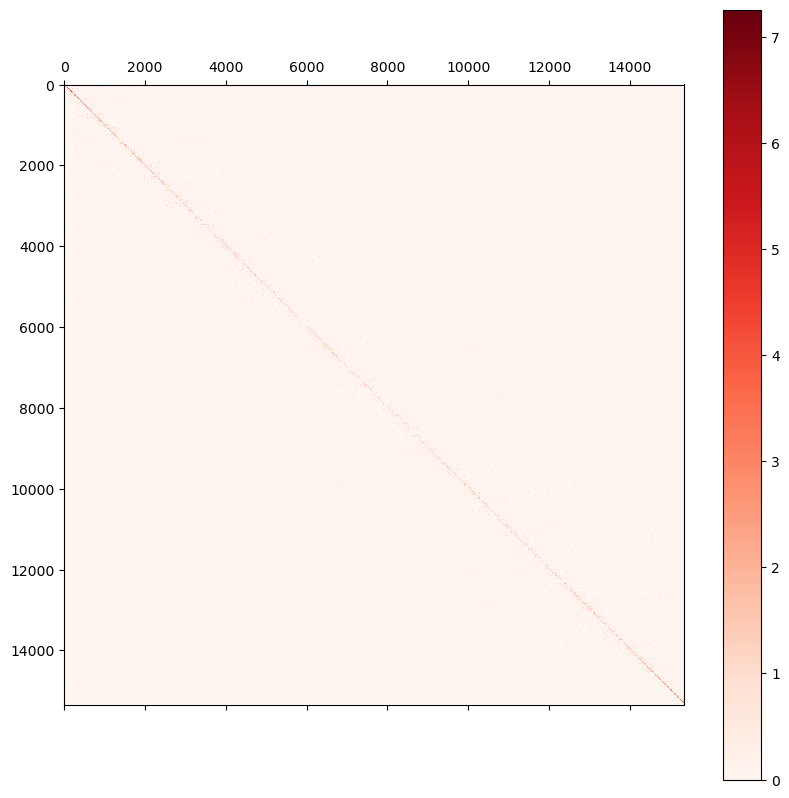
# Plot
fig = plt.figure(figsize=(10,10))
ax  = fig.add_subplot(111)
im  = ax.matshow(np.log1p(arr), cmap='Reds')
fig.colorbar(im) 

Use the new pairs

# Import the packages we will use
import os.path as op
import matplotlib.pyplot as plt
import numpy as np
import pandas
import h5py

import cooler

# The following directive activates inline plotting
%matplotlib inline
filepath = "../steps/bwa/PE/pairs/cool/SRR6502335.nodups.10000.cool"
c = cooler.Cooler(filepath)
c.info
{'bin-size': 10000,
 'bin-type': 'fixed',
 'creation-date': '2024-10-08T14:31:29.159937',
 'format': 'HDF5::Cooler',
 'format-url': 'https://github.com/open2c/cooler',
 'format-version': 3,
 'generated-by': 'cooler-0.10.2',
 'genome-assembly': 'rheMac10',
 'metadata': {},
 'nbins': 298615,
 'nchroms': 2939,
 'nnz': 67535020,
 'storage-mode': 'symmetric-upper',
 'sum': 115865253}
c.bins()[:100]
chrom start end
0 chr1 0 10000
1 chr1 10000 20000
2 chr1 20000 30000
3 chr1 30000 40000
4 chr1 40000 50000
... ... ... ...
95 chr1 950000 960000
96 chr1 960000 970000
97 chr1 970000 980000
98 chr1 980000 990000
99 chr1 990000 1000000

100 rows × 3 columns

c.matrix()
<cooler.core._selectors.RangeSelector2D at 0x14fc849042c0>
arr = c.matrix(balance=False).fetch('chrX')
arr
array([[39,  0,  4, ...,  0,  0,  0],
       [ 0,  9,  3, ...,  0,  0,  0],
       [ 4,  3, 29, ...,  0,  0,  0],
       ...,
       [ 0,  0,  0, ...,  7,  0,  0],
       [ 0,  0,  0, ...,  0,  0,  0],
       [ 0,  0,  0, ...,  0,  0,  0]], dtype=int32)
# Plot with matplotlib
fig = plt.figure(figsize=(10,10))
ax =  fig.add_subplot(111)
im =  ax.matshow(np.log1p(arr), cmap="Reds")
fig.colorbar(im)

Merge the replicates according to SRA ID

First, subset the chromosomes to only the real chromosomes

print(filepath)
print(filepath.replace('nodups', 'subset.nodups'))
../steps/bwa/PE/pairs/cool/SRR6502335.nodups.10000.cool
../steps/bwa/PE/pairs/cool/SRR6502335.subset.nodups.10000.cool

Make a loop

import cooler
import os.path as op
from pprintpp import pprint as pp

coolers = [f"../steps/bwa/PE/pairs/cool/SRR650233{n}.nodups.10000.cool" for n in range(5,10)]
print(f"Subsetting coolers and merging replicates from")
pp(coolers)

for cool in coolers:
    # Filenames
    cool_file = cool
    output_cool_file = cool_file.replace('nodups', 'subset.nodups')

    if op.exists(output_cool_file):
        print(f"Skipping {cool_file} (exists)")
        continue

    print(f"Input: {cool_file} \nOutput: {output_cool_file}\n\nInitializing cooler from input...")
    
    # Load the original .cool file
    c = cooler.Cooler(cool_file)
    
    # Define the chromosomes to keep (e.g., excluding unplaced scaffolds/contigs)
    chroms_to_keep = c.chroms()[0:22]['name']
    
    # Filter the bins to include only the selected chromosomes
    print("Filtering bins...")
    
    bins = c.bins()[:]
    filtered_bins = bins[bins['chrom'].isin(chroms_to_keep)]
    
    # Filter the pixels to include only the selected bins
    print("Filtering pixels...")
    
    bin_ids_to_keep = set(filtered_bins.index)
    pixels = c.pixels()[:]
    filtered_pixels = pixels[pixels['bin1_id'].isin(bin_ids_to_keep) & pixels['bin2_id'].isin(bin_ids_to_keep)]

    # Subset the coolers

    print("Creating subsetted cooler...")

    cooler.create_cooler(
        cool_uri=output_cool_file,
        bins=filtered_bins,
        pixels=filtered_pixels,
        assembly='rheMac10',  # Optional: specify the genome assembly
        ordered=True,  # Assuming the input chunks are in the correct order
        symmetric_upper=True,  # Assuming the input data references the upper triangle of a symmetric matrix
        mode='w',  # Write mode
        ensure_sorted=True,  # Ensure that each input chunk is properly sorted
        boundscheck=True,  # Check that all bin IDs lie in the expected range
        dupcheck=True,  # Check that no duplicate pixels exist within any chunk
        triucheck=True  # Check that bin1_id <= bin2_id when creating coolers in symmetric-upper mode
    )

    print(f"Subset .cool file created: {output_cool_file}")
Subsetting coolers and merging replicates from
[
    '../steps/bwa/PE/pairs/cool/SRR6502335.nodups.10000.cool',
    '../steps/bwa/PE/pairs/cool/SRR6502336.nodups.10000.cool',
    '../steps/bwa/PE/pairs/cool/SRR6502337.nodups.10000.cool',
    '../steps/bwa/PE/pairs/cool/SRR6502338.nodups.10000.cool',
    '../steps/bwa/PE/pairs/cool/SRR6502339.nodups.10000.cool',
]
Skipping ../steps/bwa/PE/pairs/cool/SRR6502335.nodups.10000.cool (exists)
Skipping ../steps/bwa/PE/pairs/cool/SRR6502336.nodups.10000.cool (exists)
Skipping ../steps/bwa/PE/pairs/cool/SRR6502337.nodups.10000.cool (exists)
Skipping ../steps/bwa/PE/pairs/cool/SRR6502338.nodups.10000.cool (exists)
Skipping ../steps/bwa/PE/pairs/cool/SRR6502339.nodups.10000.cool (exists)
# Merge rep1
rep1_out = "../steps/bwa/PE/pairs/cool/fib_rep1.10000.cool"
if not op.exists(rep1_out):
    cooler.merge_coolers(output_uri = rep1_out,
                         input_uris = ["../steps/bwa/PE/pairs/cool/SRR6502335.subset.nodups.10000.cool",
                                      "../steps/bwa/PE/pairs/cool/SRR6502336.subset.nodups.10000.cool"],
                         mergebuf = 20000000)
else:
    print(f"{rep1_out} already exists")
../steps/bwa/PE/pairs/cool/fib_rep1.10000.cool already exists
# Merge rep2
rep2_out = "../steps/bwa/PE/pairs/cool/fib_rep2.10000.cool"
if not op.exists(rep2_out):
    cooler.merge_coolers(output_uri = rep2_out,
                         input_uris = ["../steps/bwa/PE/pairs/cool/SRR6502337.subset.nodups.10000.cool",
                                      "../steps/bwa/PE/pairs/cool/SRR6502338.subset.nodups.10000.cool",
                                      "../steps/bwa/PE/pairs/cool/SRR6502339.subset.nodups.10000.cool"],
                         mergebuf = 20000000)
else:
    print(f"{rep1_out} already exists")
../steps/bwa/PE/pairs/cool/fib_rep1.10000.cool already exists
c_rep1 = cooler.Cooler("../steps/bwa/PE/pairs/cool/fib_rep1.10000.cool")
c_rep2 = cooler.Cooler("../steps/bwa/PE/pairs/cool/fib_rep2.10000.cool")

pp(c_rep1.info) 
pp(c_rep2.info)
{
    'bin-size': 10000,
    'bin-type': 'fixed',
    'creation-date': '2024-10-08T21:02:38.036175',
    'format': 'HDF5::Cooler',
    'format-url': 'https://github.com/open2c/cooler',
    'format-version': 3,
    'generated-by': 'cooler-0.10.2',
    'genome-assembly': 'rheMac10',
    'metadata': {},
    'nbins': 285406,
    'nchroms': 22,
    'nnz': 112572916,
    'storage-mode': 'symmetric-upper',
    'sum': 211718459,
}
{
    'bin-size': 10000,
    'bin-type': 'fixed',
    'creation-date': '2024-10-08T21:52:32.813516',
    'format': 'HDF5::Cooler',
    'format-url': 'https://github.com/open2c/cooler',
    'format-version': 3,
    'generated-by': 'cooler-0.10.2',
    'genome-assembly': 'rheMac10',
    'metadata': {},
    'nbins': 285406,
    'nchroms': 22,
    'nnz': 117207943,
    'storage-mode': 'symmetric-upper',
    'sum': 211294810,
}

zoomify the merged replicates

Generate an .mcool file containing coarser resolution to be called.

import cooler
import os.path as op

cool_paths = {'rep1': "../steps/bwa/PE/pairs/cool/fib_rep1.10000.cool",
              'rep2': "../steps/bwa/PE/pairs/cool/fib_rep2.10000.cool"}

mcool_paths = {'rep1': "../steps/bwa/PE/pairs/cool/fib_rep1.mcool",
               'rep2': "../steps/bwa/PE/pairs/cool/fib_rep2.mcool"}

for cool,path in cool_paths.items():
    if op.exists(mcool_paths[cool]):
        print(f"Skipping: {mcool_paths[cool]} already exists")
        continue

    print(f"Zoomifying cooler: \n\t   {path}\n\t-> {mcool_paths[cool]}", end="\n")
    
    cooler.zoomify_cooler(base_uris = path,
                          outfile = mcool_paths[cool],
                          resolutions = [10000,50000,100000,500000],
                          chunksize = 10000000,
                          nproc = 4)
    print(" --> done")
Skipping: ../steps/bwa/PE/pairs/cool/fib_rep1.mcool already exists
Skipping: ../steps/bwa/PE/pairs/cool/fib_rep2.mcool already exists
# to print which resolutions are stored in the mcool, use list_coolers
cooler.fileops.list_coolers(mcool_paths['rep1'])
['/resolutions/10000',
 '/resolutions/50000',
 '/resolutions/100000',
 '/resolutions/500000']

Visualize the matrices

Plot the uncorrected matrix

c1 = cooler.Cooler("../steps/bwa/PE/pairs/cool/fib_rep1.mcool::resolutions/100000")
c2 = cooler.Cooler("../steps/bwa/PE/pairs/cool/fib_rep2.mcool::resolutions/100000")
c1.info
{'bin-size': 100000,
 'bin-type': 'fixed',
 'creation-date': '2024-10-08T22:48:20.327186',
 'format': 'HDF5::Cooler',
 'format-url': 'https://github.com/open2c/cooler',
 'format-version': 3,
 'generated-by': 'cooler-0.10.2',
 'genome-assembly': 'unknown',
 'metadata': {},
 'nbins': 28550,
 'nchroms': 22,
 'nnz': 52382089,
 'storage-mode': 'symmetric-upper',
 'sum': 211718459}
arr1 = c1.matrix(balance=False).fetch('chrX')
arr2 = c2.matrix(balance=False).fetch('chrX')
# Plot with matplotlib
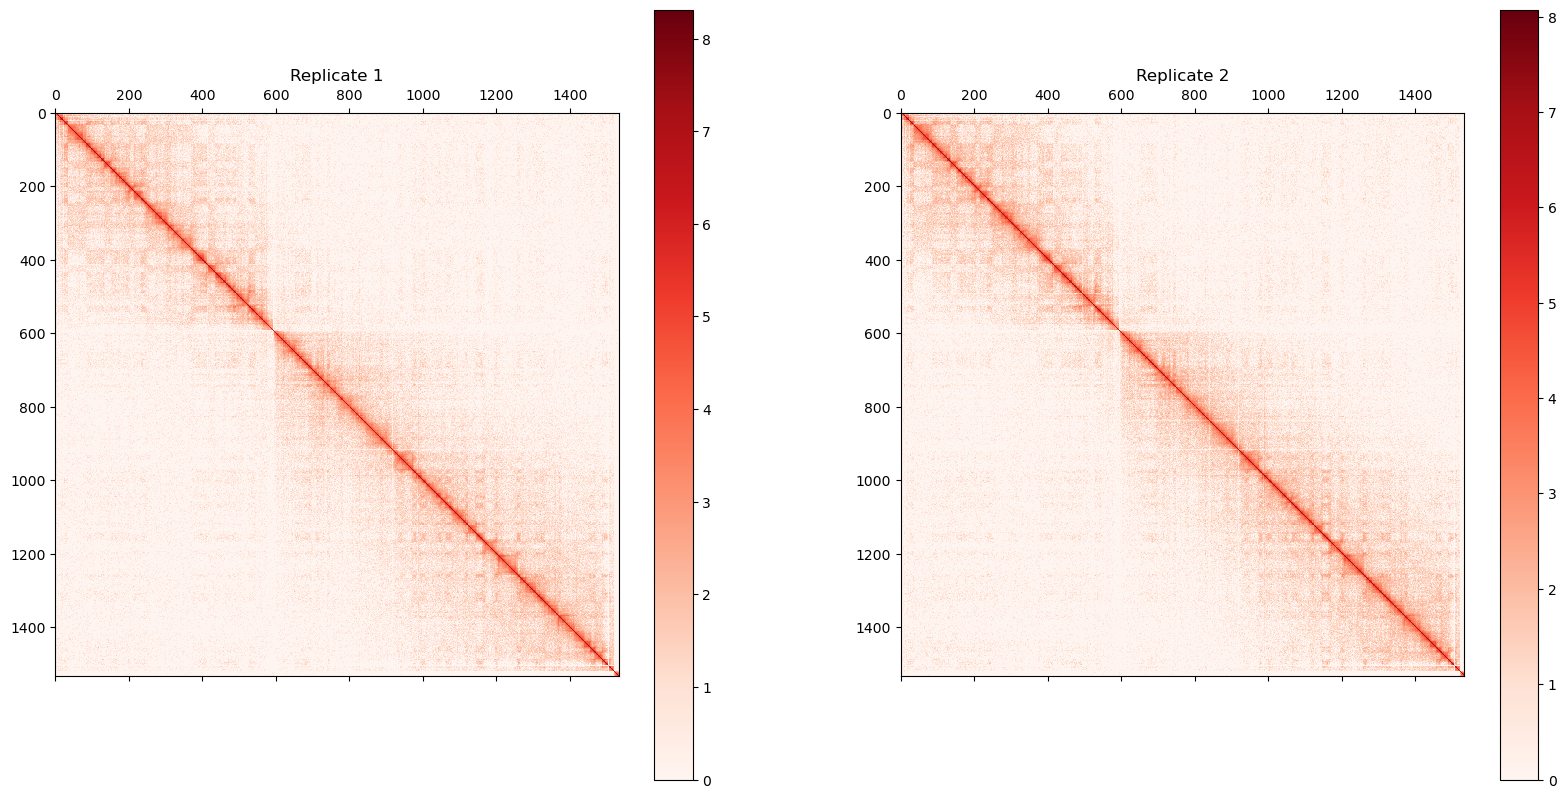
fig, (ax1, ax2) = plt.subplots(1, 2, figsize=(20, 10))

# Plot the first replicate
im1 = ax1.matshow(np.log1p(arr1), cmap="Reds")
ax1.set_title('Replicate 1')
fig.colorbar(im1, ax=ax1)

# Plot the second replicate
im2 = ax2.matshow(np.log1p(arr2), cmap="Reds")
ax2.set_title('Replicate 2')
fig.colorbar(im2, ax=ax2)

plt.show()

The X chromosome in 100kb bins and the first 3 PCs below. UNCORRECTED. Made with cooler and matplotlib.

The X chromosome in 100kb bins and the first 3 PCs below. UNCORRECTED. Made with cooler and matplotlib.

Follow `cooltools´ suggestion/guide

import cooler

c1 = cooler.Cooler("../steps/bwa/PE/pairs/cool/fib_rep1.mcool::resolutions/500000")
clr = cooler.Cooler("../steps/bwa/PE/pairs/cool/fib_rep1.mcool::resolutions/100000")
c2 = cooler.Cooler("../steps/bwa/PE/pairs/cool/fib_rep1.mcool::resolutions/50000")
### to print chromosomes and binsize for this cooler
print(f'chromosomes: {c1.chromnames}, binsize: {c1.binsize}')
print(f'chromosomes: {clr.chromnames}, binsize: {clr.binsize}')
print(f'chromosomes: {c2.chromnames}, binsize: {c2.binsize}')

### to make a list of chromosome start/ends in bins:
chromstarts = []
chromstarts500kb = []
chromstarts50kb = []
for i in clr.chromnames:
    chromstarts500kb.append(c1.extent(i)[0])
    chromstarts.append(clr.extent(i)[0])
    chromstarts50kb.append(c2.extent(i)[0])
chromosomes: ['chr1', 'chr2', 'chr5', 'chr3', 'chr6', 'chr4', 'chr7', 'chrX', 'chr8', 'chr9', 'chr11', 'chr12', 'chr14', 'chr15', 'chr13', 'chr10', 'chr17', 'chr16', 'chr20', 'chr18', 'chr19', 'chrY'], binsize: 500000
chromosomes: ['chr1', 'chr2', 'chr5', 'chr3', 'chr6', 'chr4', 'chr7', 'chrX', 'chr8', 'chr9', 'chr11', 'chr12', 'chr14', 'chr15', 'chr13', 'chr10', 'chr17', 'chr16', 'chr20', 'chr18', 'chr19', 'chrY'], binsize: 100000
chromosomes: ['chr1', 'chr2', 'chr5', 'chr3', 'chr6', 'chr4', 'chr7', 'chrX', 'chr8', 'chr9', 'chr11', 'chr12', 'chr14', 'chr15', 'chr13', 'chr10', 'chr17', 'chr16', 'chr20', 'chr18', 'chr19', 'chrY'], binsize: 50000
# to plot ticks in terms of megabases we use the EngFormatter
# https://matplotlib.org/gallery/api/engineering_formatter.html
# Also, here we fetch the chromosomes directly from within the plot
# Import the packages we will use
import os.path as op
import matplotlib.pyplot as plt
import numpy as np
import pandas
import h5py

# The following directive activates inline plotting
%matplotlib inline

from matplotlib.ticker import EngFormatter
bp_formatter = EngFormatter('b')

def format_ticks(ax, x=True, y=True, rotate=True):
    if y:
        ax.yaxis.set_major_formatter(bp_formatter)
    if x:
        ax.xaxis.set_major_formatter(bp_formatter)
        ax.xaxis.tick_bottom()
    if rotate:
        ax.tick_params(axis='x',rotation=45)


f, axs = plt.subplots(
    figsize=(14,4),
    ncols=3)

ax = axs[0]
im = ax.matshow(np.log1p(c1.matrix(balance=False)[:]), 
                #vmax=2500, 
                cmap='Reds');
plt.colorbar(im, ax=ax ,fraction=0.046, pad=0.04, label='raw counts');
ax.set_xticks(chromstarts500kb)
ax.set_xticklabels(c1.chromnames, fontsize=6)
ax.set_yticks(chromstarts500kb)
ax.set_yticklabels(c1.chromnames, fontsize=6)
ax.xaxis.tick_bottom()
ax.tick_params(axis='x',rotation=90)
ax.set_title('All data')

ax = axs[1]
im = ax.matshow(
    np.log1p(clr.matrix(balance=False).fetch('chrX')),
    cmap='Reds',
    #vmax=2500,
    extent=(0,clr.chromsizes['chrX'], clr.chromsizes['chrX'], 0)
);
plt.colorbar(im, ax=ax ,fraction=0.046, pad=0.04, label='raw counts');
ax.set_title('chrX', y=1.08)
ax.set_ylabel('position, Mb')
format_ticks(ax)

ax = axs[2]
start, end = 60_000_000, 70_000_000
region = ('chrX', start, end)
im = ax.matshow(
    np.log1p(c2.matrix(balance=False).fetch(region)),
    #vmax=2500,
    cmap='Reds',
    extent=(start, end, end, start)
);
ax.set_title(f'chrX:{start:,}-{end:,}', y=1.08)
plt.colorbar(im, ax=ax ,fraction=0.046, pad=0.04, label='raw counts');
format_ticks(ax)
plt.tight_layout()

Raw matrix. Left: All chromosomes plotted in 100kb bins. Middle: chrX in 100kb bins. Right: chrX:60Mb-70Mb in 50 kb bins

Raw matrix. Left: All chromosomes plotted in 100kb bins. Middle: chrX in 100kb bins. Right: chrX:60Mb-70Mb in 50 kb bins

Balance the matrices (iterative correction)

We balance the matrix with the command line tool, at it will make quick work of the job

The cooler resolutions have to be balanced individually, so we have 2 .mcool x 4 .cool.

It works best with at least 8 cores (default).

Bash command:

srun -c 32 –mem 16g –time=0:30:0 –account=hic-spermatogenesis –pty /bin/bash

conda activate hic cd ~/hic-spermatogenesis/people/sojern/hic-spermatogenesis/steps/bwa/PE/pairs/cool

for FILE in *.mcool; do echo “Processing $FILE” for RES in 10000 50000 100000 500000; do echo “Balancing \(FILE::resolutions/\)RES” cooler balance -p 32 \(FILE::resolutions/\)RES done done

Plot the corrected (balanced) matrix

# to plot ticks in terms of megabases we use the EngFormatter
# https://matplotlib.org/gallery/api/engineering_formatter.html
# Also, here we fetch the chromosomes directly from within the plot
# Import the packages we will use
import os.path as op
import matplotlib.pyplot as plt
import numpy as np
import pandas
import h5py

# The following directive activates inline plotting
%matplotlib inline

from matplotlib.ticker import EngFormatter
from matplotlib.colors import LogNorm

bp_formatter = EngFormatter('b')
norm = LogNorm(vmax=0.1)

def format_ticks(ax, x=True, y=True, rotate=True):
    if y:
        ax.yaxis.set_major_formatter(bp_formatter)
    if x:
        ax.xaxis.set_major_formatter(bp_formatter)
        ax.xaxis.tick_bottom()
    if rotate:
        ax.tick_params(axis='x',rotation=45)


f, axs = plt.subplots(
    figsize=(14,4),
    ncols=3)

ax = axs[0]
im = ax.matshow(c1.matrix(balance=True)[:], 
                #vmax=2500, 
                norm=norm,
                cmap='Reds');
plt.colorbar(im, ax=ax ,fraction=0.046, pad=0.04, label='corrected counts');
ax.set_xticks(chromstarts500kb)
ax.set_xticklabels(c1.chromnames, fontsize=6)
ax.set_yticks(chromstarts500kb)
ax.set_yticklabels(c1.chromnames, fontsize=6)
ax.xaxis.tick_bottom()
ax.tick_params(axis='x',rotation=90)
ax.set_title('All data')

ax = axs[1]
im = ax.matshow(
    clr.matrix(balance=True).fetch('chrX'),
    cmap='Reds',
    norm=norm,
    extent=(0,clr.chromsizes['chrX'], clr.chromsizes['chrX'], 0)
);
plt.colorbar(im, ax=ax ,fraction=0.046, pad=0.04, label='corrected counts');
ax.set_title('chrX', y=1.08)
ax.set_ylabel('position, Mb')
format_ticks(ax)

ax = axs[2]
start, end = 60_000_000, 70_000_000
region = ('chrX', start, end)
im = ax.matshow(
    c2.matrix(balance=True).fetch(region),
    #vmax=2500,
    norm=norm,
    cmap='Reds',
    extent=(start, end, end, start)
);
ax.set_title(f'chrX:{start:,}-{end:,}', y=1.08)
plt.colorbar(im, ax=ax ,fraction=0.046, pad=0.04, label='corrected counts');
format_ticks(ax)
plt.tight_layout()

Corrected matrix. Left: All chromosomes plotted in 100kb bins. Middle: chrX in 100kb bins. Right: chrX:60Mb-70Mb in 50 kb bins

Corrected matrix. Left: All chromosomes plotted in 100kb bins. Middle: chrX in 100kb bins. Right: chrX:60Mb-70Mb in 50 kb bins
c1.matrix(balance=False).fetch('chrX')
array([[2214,  944,  362, ...,    1,    1,    0],
       [ 944, 6699, 1066, ...,    6,    2,    2],
       [ 362, 1066, 7639, ...,    2,    1,    2],
       ...,
       [   1,    6,    2, ..., 4317,  771,  292],
       [   1,    2,    1, ...,  771, 7897, 1001],
       [   0,    2,    2, ...,  292, 1001, 5077]], dtype=int32)
c1.bins()[:10]
chrom start end weight
0 chr1 0 500000 0.006092
1 chr1 500000 1000000 0.008288
2 chr1 1000000 1500000 0.006928
3 chr1 1500000 2000000 0.005282
4 chr1 2000000 2500000 0.005112
5 chr1 2500000 3000000 0.005096
6 chr1 3000000 3500000 0.005121
7 chr1 3500000 4000000 0.004835
8 chr1 4000000 4500000 0.004252
9 chr1 4500000 5000000 0.004451

Visualize weights as well

import os.path as op
import matplotlib.pyplot as plt
import numpy as np
import pandas
import h5py
import cooltools.lib.plotting


# The following directive activates inline plotting
%matplotlib inline

from matplotlib.ticker import EngFormatter
from matplotlib.colors import LogNorm

bp_formatter = EngFormatter('b')

def format_ticks(ax, x=True, y=True, rotate=True):
    if y:
        ax.yaxis.set_major_formatter(bp_formatter)
    if x:
        ax.xaxis.set_major_formatter(bp_formatter)
        ax.xaxis.tick_bottom()
    if rotate:
        ax.tick_params(axis='x',rotation=45)
import cooler

c100 = cooler.Cooler("../steps/bwa/PE/pairs/cool/fib_rep1.mcool::resolutions/100000")
c50 = cooler.Cooler("../steps/bwa/PE/pairs/cool/fib_rep1.mcool::resolutions/50000")
%%capture matrix_weights

### plot the raw and corrected data in logscale ###
from mpl_toolkits.axes_grid1 import make_axes_locatable

# Initialize the plot grid: rows, cols, rel_widths etc.
plt_width=4
f, axs = plt.subplots(
    figsize=( plt_width+plt_width+2, plt_width+plt_width+1),
    ncols=4,
    nrows=3,
    gridspec_kw={'height_ratios':[4,4,1],"wspace":0.01,'width_ratios':[1,.05,1,.05]},
    constrained_layout=True
)

# Set the colorscale to fit the log scale
norm = LogNorm(vmax=0.1)
norm_raw = LogNorm(vmin=1, vmax=10_000)

# Set the first cell in the grid
ax = axs[0,0]
im = ax.matshow(
    c100.matrix(balance=False).fetch('chrX'),
    norm=norm_raw,
    cmap='fall',
    aspect='auto',
    extent=(0,c100.chromsizes['chrX'], c100.chromsizes['chrX'], 0)
);
ax.xaxis.set_visible(False)
ax.set_title('chr X')
ax.set_ylabel('raw', fontsize=16)
format_ticks(ax, x=False,y=True)

# Set the colorbar next to the plot
cax = axs[0,1]
plt.colorbar(im, cax=cax, label='raw counts')

# Second row, 1st column
ax = axs[1,0]
im = ax.matshow(
    c100.matrix().fetch('chrX'),
    norm=norm,
    cmap='fall',
    extent=(0,c100.chromsizes['chrX'], c100.chromsizes['chrX'], 0)
);
ax.xaxis.set_visible(False)
ax.set_ylabel('balanced', fontsize=16)
format_ticks(ax, x=False,y=True)

# Set colorbar
cax = axs[1,1]
plt.colorbar(im, cax=cax, label='corrected freqs')

# 3rd row, 1st col (weights)
ax1 = axs[2,0]
weights = c100.bins().fetch('chrX')['weight'].values
ax1.plot(
    np.linspace(0, c100.chromsizes['chrX'], len(weights)),
    weights
)
ax1.set_xlim([0, c100.chromsizes['chrX']])
ax1.set_xlabel('position, bp')
format_ticks(ax1, y=False)

ax1 = axs[2,1]
ax1.set_visible(False)


# 2nd column
start = 60_000_000
end = 70_000_000
region = ('chrX', start, end)

# Unbalanced
ax = axs[0,2]
im = ax.matshow(
    c50.matrix(balance=False).fetch(region),
    norm=norm_raw,
    cmap='fall',
    extent=(start, end, end, start)
);
ax.set_title(f'chrX:{start:,}-{end:,}')
ax.xaxis.set_visible(False)

cax = axs[0,3]
plt.colorbar(im, cax=cax, label='raw counts');

# Balanced
ax = axs[1,2]
im = ax.matshow(
    c50.matrix().fetch(region),
    norm=norm,
    cmap='fall',
    extent=(start, end, end, start)
);
ax.xaxis.set_visible(False)

cax = axs[1,3]
plt.colorbar(im, cax=cax, label='corrected frequencies');

ax1 = axs[2,2]
weights = c50.bins().fetch(region)['weight'].values
ax1.plot(
    np.linspace(start, end, len(weights)),
    weights
)
format_ticks(ax1, y=False, rotate=False)
ax1.set_xlim(start, end);
ax1.set_xlabel('chrX position, bp')

ax1 = axs[2,3]
ax1.set_visible(False)

# NB The output is captured and saved to a callable variable
matrix_weights()

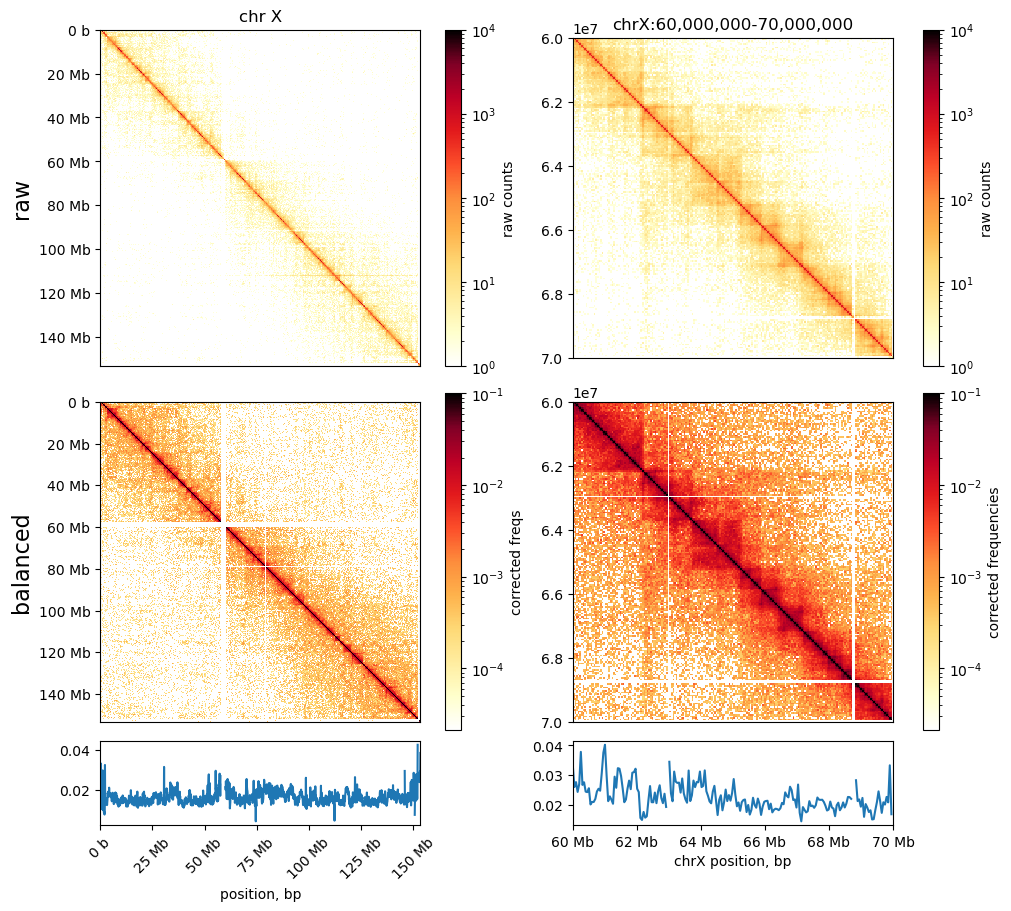
Rep1 interaction matrix with weights visualized. Top: raw counts. Bottom: corrected frequencies. Left: whole chrX. Right: chrX60:70Mb

Rep1 interaction matrix with weights visualized. Top: raw counts. Bottom: corrected frequencies. Left: whole chrX. Right: chrX60:70Mb

Coverage (distinct from the weights)

%%capture matrix_weights_coverage

clr = cooler.Cooler("../steps/bwa/PE/pairs/cool/fib_rep1.mcool::resolutions/500000")
cis_coverage, tot_coverage = cooltools.coverage(clr, nproc=4)

f, ax = plt.subplots(
    figsize=(15, 10),
)

norm = LogNorm(vmax=0.1)

im = ax.matshow(
    clr.matrix()[:],
    norm=norm,
    cmap='fall'
);
divider = make_axes_locatable(ax)
cax = divider.append_axes("right", size="5%", pad=0.1)
plt.colorbar(im, cax=cax, label='corrected frequencies');
ax.set_title('full matrix')
ax.xaxis.set_visible(False)

ax1 = divider.append_axes("bottom", size="25%", pad=0.1, sharex=ax)
weights = clr.bins()[:]['weight'].values
ax1.plot( cis_coverage, label='cis')
ax1.plot( tot_coverage, label='total')
ax1.set_xlim([0, len(clr.bins()[:])])
ax1.set_ylabel('Coverage')
ax1.legend()
ax1.set_xticks([])

ax2 = divider.append_axes("bottom", size="25%", pad=0.1, sharex=ax)
ax2.plot( cis_coverage/ tot_coverage)
ax2.set_xlim([0, len(clr.bins()[:])])
ax2.set_ylabel('coverage ratio')

# NB plot is captured to variable
INFO:root:creating a Pool of 4 workers
matrix_weights_coverage.outputs[1]

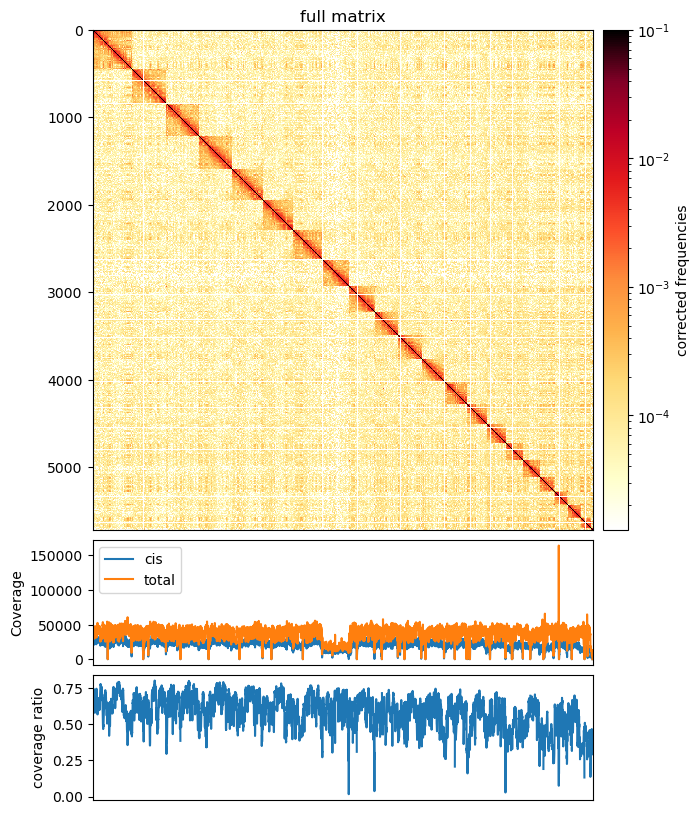
Rep1 chrX interaction matrix with coverage for cis and total as well as cis/total coverage ratio.

Rep1 chrX interaction matrix with coverage for cis and total as well as cis/total coverage ratio.

Smoothing and interpolation

import os.path as op
import matplotlib.pyplot as plt
import numpy as np
import pandas
import h5py
import cooltools.lib.plotting


# The following directive activates inline plotting
%matplotlib inline

from matplotlib.ticker import EngFormatter
from matplotlib.colors import LogNorm

bp_formatter = EngFormatter('b')

def format_ticks(ax, x=True, y=True, rotate=True):
    if y:
        ax.yaxis.set_major_formatter(bp_formatter)
    if x:
        ax.xaxis.set_major_formatter(bp_formatter)
        ax.xaxis.tick_bottom()
    if rotate:
        ax.tick_params(axis='x',rotation=45)
%%capture smoothed_interpolated

from cooltools.lib.numutils import adaptive_coarsegrain, interp_nan

clr_10kb = c50

start = 60_000_000
end = 70_000_000
region = ('chrX', start, end)
extents = (start, end, end, start)

cg = adaptive_coarsegrain(clr_10kb.matrix(balance=True).fetch(region),
                              clr_10kb.matrix(balance=False).fetch(region),
                              cutoff=3, max_levels=8)

cgi = interp_nan(cg)

f, axs = plt.subplots(
    figsize=(18,5),
    nrows=1,
    ncols=3,
    sharex=True, sharey=True)

ax = axs[0]
im = ax.matshow(clr_10kb.matrix(balance=True).fetch(region), cmap='fall', norm=norm, extent=extents)
ax.set_title('corrected')

ax = axs[1]
im2 = ax.matshow(cg, cmap='fall', norm=norm, extent=extents)
ax.set_title(f'adaptively coarsegrained')

ax = axs[2]
im3 = ax.matshow(cgi, cmap='fall', norm=norm, extent=extents)
ax.set_title(f'interpolated')

for ax in axs:
    format_ticks(ax, rotate=False)

plt.colorbar(im3, ax=axs, fraction=0.046, label='corrected frequencies')
smoothed_interpolated.outputs[1]

Normal, smoothed, and interpolated views of the interaction matrix. Functions provided by cooltools.

Normal, smoothed, and interpolated views of the interaction matrix. Functions provided by cooltools.

Counts vs. Distance

To follow the cooltools analysis pipe, we can do this stuff before analyzing compartments.

Compartments

Here, we will use cooltools in combination with cooler to find the A/B compartments in the chromatin of rep1 and rep2

# import standard python libraries
import numpy as np
import matplotlib.pyplot as plt
%matplotlib inline
import pandas as pd
import os, subprocess
# Import python package for working with cooler files and tools for analysis
import cooler
import cooltools.lib.plotting
import cooltools
cool_file = "../steps/bwa/PE/cool/fibroblast/unordered/fib_rep1.mcool"

clr = cooler.Cooler(f"{cool_file}::resolutions/100000")
import bioframe

bins = clr.bins()[:]
rheMac10 = bioframe.load_fasta('../data/links/ucsc_ref/rheMac10.fa')
if not os.path.exists('../steps/rheMac10_gc_cov_100kb.tsv'):
    print('Calculate the fraction of GC basepairs for each bin')
    gc_cov = bioframe.frac_gc(bins[['chrom', 'start', 'end']], rheMac10)
    gc_cov.to_csv('../steps/rheMac10_gc_cov_100kb.tsv', index=False,sep='\t')
    display(gc_cov)
else: 
    print("Already exists, just read from file:")
    gc_cov = pd.read_csv("../steps/rheMac10_gc_cov_100kb.tsv", sep='\t')
    display(gc_cov)
Already exists, just read from file:
chrom start end GC
0 chr1 0 100000 0.46120
1 chr1 100000 200000 0.45493
2 chr1 200000 300000 0.42540
3 chr1 300000 400000 0.40310
4 chr1 400000 500000 0.37791
... ... ... ... ...
28545 chrY 11300000 11400000 NaN
28546 chrY 11400000 11500000 NaN
28547 chrY 11500000 11600000 NaN
28548 chrY 11600000 11700000 NaN
28549 chrY 11700000 11753682 NaN

28550 rows × 4 columns

# Apparently, we have som NaN values, I don't know why (and only 1 on the X)
gc_cov[gc_cov['GC'].isna()].groupby('chrom').size()
chrom
chr1      9
chr10    21
chr11    11
chr12     9
chr13     9
chr14     9
chr15    21
chr16    13
chr17    10
chr18     9
chr19    15
chr2     10
chr20     9
chr3      9
chr4      9
chr5      9
chr6      9
chr7      9
chr8     14
chr9     11
chrX      1
chrY      5
dtype: int64
view_df = pd.DataFrame(
    {
    'chrom': clr.chromnames,
    'start': 0,
    'end': clr.chromsizes.values,
    'name': clr.chromnames
    }
                      )
display(view_df)
chrom start end name
0 chr1 0 223616942 chr1
1 chr2 0 196197964 chr2
2 chr5 0 187317192 chr5
3 chr3 0 185288947 chr3
4 chr6 0 179085566 chr6
5 chr4 0 169963040 chr4
6 chr7 0 169868564 chr7
7 chrX 0 153388924 chrX
8 chr8 0 145679320 chr8
9 chr9 0 134124166 chr9
10 chr11 0 133066086 chr11
11 chr12 0 130043856 chr12
12 chr14 0 128056306 chr14
13 chr15 0 113283604 chr15
14 chr13 0 108737130 chr13
15 chr10 0 99517758 chr10
16 chr17 0 95433459 chr17
17 chr16 0 79627064 chr16
18 chr20 0 77137495 chr20
19 chr18 0 74474043 chr18
20 chr19 0 58315233 chr19
21 chrY 0 11753682 chrY
# obtain first 3 eigenvectors
cis_eigs = cooltools.eigs_cis(
                        clr,
                        gc_cov,
                        view_df=view_df,
                        n_eigs=3,
                        )


# cis_eigs[0] returns eigenvalues, here we focus on eigenvectors
eigenvector_track = cis_eigs[1][['chrom','start','end','E1']]
len(eigenvector_track)
28550
# full track
eigenvector_track
chrom start end E1
0 chr1 0 100000 -0.228667
1 chr1 100000 200000 -0.788762
2 chr1 200000 300000 -1.014925
3 chr1 300000 400000 -0.917771
4 chr1 400000 500000 -0.935396
... ... ... ... ...
28545 chrY 11300000 11400000 NaN
28546 chrY 11400000 11500000 NaN
28547 chrY 11500000 11600000 NaN
28548 chrY 11600000 11700000 NaN
28549 chrY 11700000 11753682 NaN

28550 rows × 4 columns

# subset the chrX   
eigenvector_track_chrX = eigenvector_track.loc[eigenvector_track['chrom'] == 'chrX'].reset_index()
nbins = len(eigenvector_track_chrX)
eigenvector_track_chrX
e1X_values = eigenvector_track_chrX['E1'].values
e1X_values
array([-0.11264475,         nan,         nan, ..., -0.20557911,
       -0.29015582, -0.1779123 ])

#len(eigenvector_track_chrX['E1'] < 0 )
print( (eigenvector_track_chrX['E1'] < 0 ).astype(int))
print(np.diff( (eigenvector_track_chrX['E1'] < 0 ).astype(int)))
print(np.where(np.diff( (eigenvector_track_chrX['E1'] < 0 ).astype(int))))
#np.where(np.diff( (eigenvector_track_chrX['E1'] < 0 ).astype(int)))[0]
0       1
1       0
2       0
3       1
4       1
       ..
1529    1
1530    1
1531    1
1532    1
1533    1
Name: E1, Length: 1534, dtype: int64
[-1  0  1 ...  0  0  0]
(array([   0,    2,    7,    8,    9,   15,   16,   34,   64,   68,   82,
        136,  149,  204,  215,  250,  276,  280,  286,  287,  297,  302,
        303,  305,  309,  315,  326,  327,  329,  330,  370,  371,  372,
        420,  423,  424,  433,  493,  494,  500,  502,  507,  510,  511,
        512,  517,  520,  522,  524,  547,  556,  558,  560,  561,  564,
        566,  567,  569,  572,  575,  576,  591,  592,  599,  605,  606,
        621,  625,  634,  635,  644,  645,  651,  666,  667,  697,  709,
        710,  711,  716,  740,  748,  774,  775,  779,  780,  789,  790,
        817,  818,  826,  828,  888,  889,  931,  945,  973,  984,  989,
        990,  991, 1010, 1025, 1026, 1027, 1028, 1031, 1032, 1033, 1052,
       1061, 1079, 1083, 1084, 1092, 1095, 1114, 1115, 1116, 1121, 1126,
       1127, 1142, 1168, 1180, 1181, 1197, 1204, 1210, 1211, 1212, 1213,
       1255, 1266, 1269, 1270, 1279, 1280, 1282, 1284, 1288, 1291, 1294,
       1304, 1305, 1331, 1358, 1361, 1370, 1375, 1438, 1439, 1441, 1449,
       1451, 1470, 1487, 1515, 1517, 1518, 1520, 1522, 1523, 1524]),)
%%capture chrX_matrix_e1

from matplotlib.colors import LogNorm
from mpl_toolkits.axes_grid1 import make_axes_locatable

f, ax = plt.subplots(
    figsize=(15, 10),
)

norm = LogNorm(vmax=0.1)

im = ax.matshow(
    clr.matrix().fetch('chrX'),
    norm=norm,
    cmap='fall',
);
plt.axis([0,nbins,nbins,0])


divider = make_axes_locatable(ax)
cax = divider.append_axes("right", size="5%", pad=0.1)
plt.colorbar(im, cax=cax, label='corrected frequencies');
ax.set_ylabel('chrX:100kb bins, #bin')
ax.xaxis.set_visible(False)

ax1 = divider.append_axes("top", size="20%", pad=0.25, sharex=ax)
weights = clr.bins()[:]['weight'].values
#ax1.plot([0,nbins],[0,0],'k',lw=0.25)

#ax1.plot(e1X_values, label='E1')

# Fill between the line and 0
ax1.fill_between(range(len(e1X_values)), e1X_values, 0, where=(e1X_values > 0), color='tab:red')
ax1.fill_between(range(len(e1X_values)), e1X_values, 0, where=(e1X_values < 0), color='C0')

ax1.set_ylabel('E1')
ax1.set_xticks([]);


for i in np.where(np.diff( (eigenvector_track_chrX['E1'] < 0 ).astype(int)))[0]:
    # Horisontal lines where E1 intersects 0
    ax.plot([0,nbins],[i,i],'k',lw=0.5)

    # Vertical lines where E1 intersects 0
    ax.plot([i,i],[0,nbins],'k',lw=0.5)
chrX_matrix_e1()

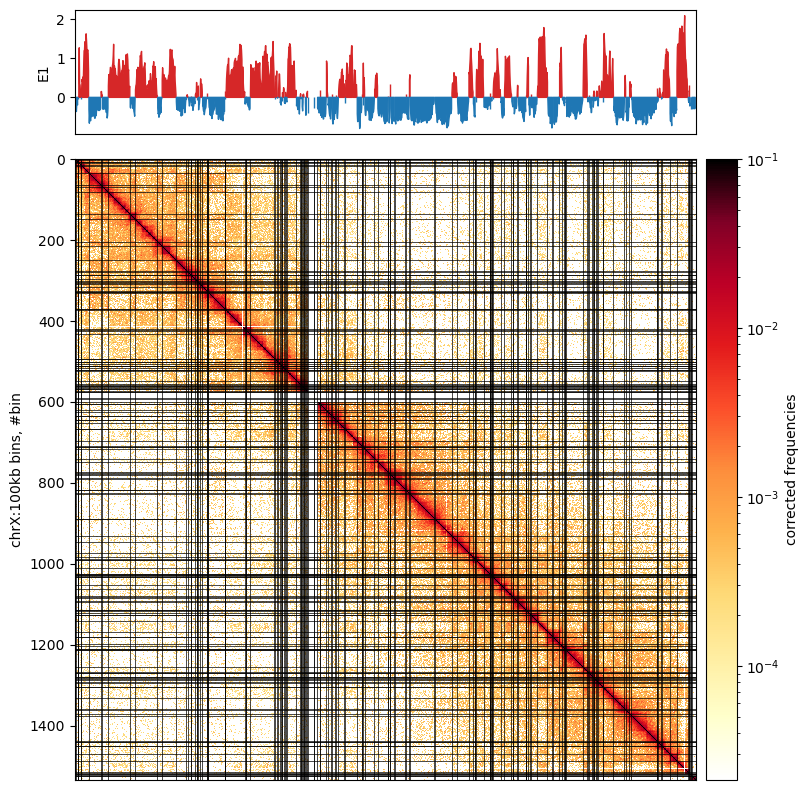
chrX interaction matrix with E1 eigenvector values.

chrX interaction matrix with E1 eigenvector values.
import matplotlib.pyplot as plt

f, ax1 = plt.subplots(
    figsize=(10, 2),
)

# Fill between the line and 0
ax1.fill_between(range(len(e1X_values)), e1X_values, 0, where=(e1X_values > 0), color='tab:red')
ax1.fill_between(range(len(e1X_values)), e1X_values, 0, where=(e1X_values < 0), color='C0')

#ax1.set_ylabel('E1')
ax1.set_xticks([])
ax1.set_yticks([])

# Remove borders
ax1.spines['top'].set_visible(False)
ax1.spines['right'].set_visible(False)
ax1.spines['left'].set_visible(False)
ax1.spines['bottom'].set_visible(False)

plt.tight_layout()

# Save the plot as a high-resolution PNG file
#plt.savefig('../steps/e1_plot.svg', dpi=320, bbox_inches='tight')

plt.show()

100kb binned E1 eigenvector values for chrX. Freshly calculated from the cooler file.

100kb binned E1 eigenvector values for chrX. Freshly calculated from the cooler file.