import matplotlib.pyplot as plt

# Define my params:
## Params will comply with my desired layout for the Manuscript (PDF)

notebook_rcparams = {
    'font.size': 7,
    'axes.titlesize': 8,
    'axes.labelsize': 7,
    'xtick.labelsize': 6,
    'ytick.labelsize': 6,
    'figure.titlesize': 9,
    'figure.figsize': [6.0, 2.0],
    'figure.labelsize': 7,
    'legend.fontsize': 6,

}

# Apply config
%matplotlib inline
%config InlineBackend.figure_formats = ['retina']
%config InlineBackend.rc = notebook_rcparamsE1 vs. ECH (recommended params)
Overlaying the A-Compartments with Extended Common Haplotypes
The genomic regions in question
In 05_rec_compartments.ipynb we extracted the genomic intervals of A compartments on all cell types in all combinations of the following parameters:
- Cell type: fibroblast, spermatocyte, pachytene spermatocyte, round spermatid, sperm
- Chromosome: X
- E1 restriction: full-chromosome, chromosome arms, 10Mb windows
- Resolution: 100 kb, 500 kb, ps500kb (smoothed 100kb)
Resulting in 45 .csv files. They are saved to ../results/rec_compartments/.
Setup inline backend
InlineBackend.rc
For consistent plots that fit with pdf manus.
print({key:plt.rcParams[key] for key in notebook_rcparams.keys()}){'font.size': 10.0, 'axes.titlesize': 'large', 'axes.labelsize': 'medium', 'xtick.labelsize': 'medium', 'ytick.labelsize': 'medium', 'figure.titlesize': 'large', 'figure.figsize': [6.4, 4.8], 'figure.labelsize': 'large', 'legend.fontsize': 'medium'}## Apparently IPython needs this twice to understand??
import matplotlib.pyplot as plt
# Define my params:
## Params will comply with my desired layout for the Manuscript (PDF)
notebook_rcparams = {
'font.size': 7,
'axes.titlesize': 8,
'axes.labelsize': 7,
'xtick.labelsize': 6,
'ytick.labelsize': 6,
'figure.titlesize': 9,
'figure.figsize': [6.0, 2.0],
'figure.labelsize': 7,
'legend.fontsize': 6,
}
# Apply config
%matplotlib inline
%config InlineBackend.figure_formats = ['retina']
%config InlineBackend.rc = notebook_rcparamsprint({key:plt.rcParams[key] for key in notebook_rcparams.keys()}){'font.size': 7.0, 'axes.titlesize': 8.0, 'axes.labelsize': 7.0, 'xtick.labelsize': 6.0, 'ytick.labelsize': 6.0, 'figure.titlesize': 9.0, 'figure.figsize': [6.0, 2.0], 'figure.labelsize': 7.0, 'legend.fontsize': 6.0}Import compartments
import pandas as pd
import os

# Directory containing your .csv files
csv_dir = '../results/rec_compartments/'

# Create a dictionary to store the DataFrames
dataframes = {}

# Iterate over all .csv files in the directory
for filename in os.listdir(csv_dir):
    if filename.endswith('.csv') and 'e1' not in filename:  # Check for .csv files
        # Construct the full file path
        filepath = os.path.join(csv_dir, filename)

        # Load the CSV into a DataFrame
        # Use the filename (without extension) as the dictionary key
        key = filename.replace('_a_comp_coords_', '_')
        key = os.path.splitext(key)[0]
        dataframes[key] = pd.read_csv(filepath)
        dataframes[key]['length'] = dataframes[key]['end'] - dataframes[key]['start']

# The `dataframes` dictionary now contains the DataFrames
dataframes.keys()

ech90 = pd.read_csv('../data/ech90_human_Mmul_10.csv')
ech90['length'] = ech90['end'] - ech90['start']

# Load the chromosome sizes
chromsizes = (pd.read_csv(
    '../data/rheMac10.filtered.chrom.sizes',
    sep='\t',
    index_col='chrom',
    header=None,
    names=['chrom','size'])
.to_dict()['size']
)
Define a plotting function
# Kaspers plotting function
import pandas as pd
import matplotlib.pyplot as plt
import numpy as np

%config InlineBackend.figure_format = 'svg'

def plot_intervals(query=None, annot=None, **kwargs):

    tups = []
    if query is not None:
        tups.append(('query', query))
    if annot is not None:
        tups.append(('annot', annot))
    tups.extend(kwargs.items())
    tups = reversed(tups)

    df_list = []
    labels = []
    for label, df in tups:
        labels.append(label)
        df['label'] = label
        df_list.append(df)
    bigdf = pd.concat(df_list)

    bigdf['chrom'] = pd.Categorical(bigdf['chrom'], bigdf['chrom'].unique())
    bigdf['label'] = pd.Categorical(bigdf['label'], bigdf['label'].unique())

    gr = bigdf.groupby('chrom', observed=False)
    fig, axes = plt.subplots(gr.ngroups, 1, figsize=(10, 1.5*gr.ngroups),
                            sharey=True
                            #  sharex=True
                             )
    if type(axes) is not np.ndarray:
        # in case there is only one axis so it not returned as a list
        axes = np.array([axes])

    # with plt.style.context(('default')):

    for i, chrom in enumerate(gr.groups):
        _df = gr.get_group(chrom)
        _gr = _df.groupby('label', observed=False)
        for y, label in enumerate(_gr.groups):
            try:
                df = _gr.get_group(label)
            except KeyError:
                continue
            y = np.repeat(y, df.index.size)
            axes[i].hlines(y, df.start.tolist(), df.end.tolist(), alpha=0.5, lw=5, colors=f'C{y[0]}')
            delta = len(labels)/10
            axes[i].vlines(df.start.tolist(), y-delta, y+delta, alpha=0.5, lw=2, colors=f'C{y[0]}')
            axes[i].vlines(df.end.tolist(), y-delta, y+delta, alpha=0.5, lw=2, colors=f'C{y[0]}')

        axes[i].spines['top'].set_visible(False)
        axes[i].spines['left'].set_visible(False)
        axes[i].spines['right'].set_visible(False)

        axes[i].set_yticks(list(range(len(labels))), labels)
        axes[i].tick_params(axis='y', which='both', left=False)
        axes[i].set_ylim(-1, len(labels)-0.7)
        # axes[i].set_xlim(df.start.min()-delta, df.end.max()+delta)
        if i != gr.ngroups-1:
            axes[i].tick_params(axis='x', which='both', bottom=False)

        axes[i].set_title(chrom, loc='left', fontsize=10)
    plt.tight_layout()
# MY PLOTTING FUNCTION
import matplotlib.pyplot as plt
import numpy as np
import pandas as pd
from matplotlib.patches import Rectangle
from mpl_toolkits.axes_grid1 import make_axes_locatable
from genominterv import interval_intersect
def plot_regions(query=None, annot=None, intersect=None,
track_titles=['query', 'annot', 'intersect'],
figsize=(10, 1),
title='chrom',
alpha=0.8, lw=0):
chrom = annot['chrom'].unique()[0]
chromsizes = pd.read_csv('../data/rheMac10.filtered.chrom.sizes', sep='\t', header=None, names=['chrom', 'size'])
base_size = chromsizes[chromsizes['chrom'] == chrom]['size'].values[0]
annot_size = annot['end'].max()
query_size = query['end'].max()
chromsize = max(base_size, annot_size, query_size)
if title == 'chrom':
title = chrom
# Define the plot size
f, ax = plt.subplots(figsize=figsize, sharex=True)
ax.spines[:].set_visible(False)
# Plot the annot
# Iterate over each interval in the DataFrame
for start, end in zip(annot['start'], annot['end']):
rect = Rectangle((start, 0.1), width=end-start, height=0.9, color='tab:red', linewidth=lw, alpha=alpha)
ax.add_patch(rect)
ax.spines['bottom'].set_visible(True)
ax.set_ylabel(track_titles[1], rotation=0, labelpad=10, ha='right', va='center')
divider = make_axes_locatable(ax)
if query is not None:
qax = divider.append_axes("top", size="100%", pad=0.05, sharex=ax)
qax.xaxis.set_visible(False)
# Plot the query
for start, end in zip(query['start'], query['end']):
rect = Rectangle((start, 0.1), width=end-start, height=0.9, color='tab:blue', linewidth=lw, alpha=alpha)
qax.add_patch(rect)
qax.spines[:].set_visible(False)
qax.set_yticks([])
qax.set_title(title, loc='left')
qax.set_ylabel(track_titles[0], rotation=0, labelpad=10, ha='right', va='center')
if intersect is not None:
iax = divider.append_axes("bottom", size="100%", pad=0.05, sharex=ax)
# Invisible x-axis for 'annot' (intersect ie below)
ax.xaxis.set_visible(False)
# Plot the intersect
for start, end in zip(intersect['start'], intersect['end']):
rect = Rectangle((start, 0.1), width=end-start, height=0.9, color='tab:green', linewidth=lw, alpha=alpha)
iax.add_patch(rect)
iax.spines[:].set_visible(False)
iax.set_yticks([])
ax.spines['bottom'].set_visible(False)
iax.spines['bottom'].set_visible(True)
iax.set_ylabel(track_titles[2], rotation=0, labelpad=10, ha='right', va='center')
ax.set_yticks([])
ax.set_xlim(0, chromsize)
ticks = np.linspace(0, chromsize, num=5)
ax.set_xticks(ticks)
ax.set_xticklabels([f'{int(t/1e6)} Mbp' for t in ticks])
f.tight_layout()
plt.show()
#plt.tight_layout()
Time to unleash genominterv on the .csv files
Test with a subsample of the data
annot = dataframes['round_spermatid_100kb_arms']
query = ech90
intersect = interval_intersect(annot, query)

plot_intervals(query, annot, intersection=intersect)
plot_regions(query, annot, intersect)

from genominterv import proximity_test, interval_collapse, interval_diff, interval_intersect, jaccard_stat

annot = dataframes['round_spermatid_100kb_arms']
query = ech90

#plot_intervals(query=query, annot=annot)

for key,annot in dataframes.items():
    # Filter out subset
    if ('round_spermatid_100') in key and not 'full' in key:
        # Plot the intervals
        intersection = interval_intersect(query, annot)
        plot_intervals(query=query, annot=annot, intersection=intersection)
        plt.title(key)

        # Do a proximity test
        print(f"Tests for {key}")
        annot_collapsed = interval_collapse(annot)
        non_ovl_query = interval_diff(query, annot_collapsed)
        print("Proximity:", proximity_test(non_ovl_query, annot_collapsed))
        print("Jaccard:", jaccard_stat(query, annot))
        print()
Tests for round_spermatid_100kb_arms_smoothed
Proximity: TestResult(statistic=0.3711999999999999, pvalue=0.0204)
Jaccard: 0.03771152626674943

Tests for round_spermatid_100kb_10Mb
Proximity: TestResult(statistic=0.51525, pvalue=0.0)
Jaccard: 0.046023479610810235

Tests for round_spermatid_100kb_10Mb_smoothed
Proximity: TestResult(statistic=0.46520000000000006, pvalue=0.0049)
Jaccard: 0.042623832902054265

Tests for round_spermatid_100kb_arms
Proximity: TestResult(statistic=0.37199999999999966, pvalue=0.0121)
Jaccard: 0.046543092859550536


Bootstrap to get a p-value
from genominterv import bootstrap

annot = dataframes['round_spermatid_100kb_arms']
chromsizes = pd.read_csv('../data/rheMac10.filtered.chrom.sizes', sep='\t', index_col='chrom', header=None, names=['chrom','size']).to_dict()['size']
#display(chromsizes)

@bootstrap(chromsizes, samples=1000)
def jaccard_bootstrap(query, annot):
    return jaccard_stat(query, annot)

jacccard_stat, p_value = jaccard_bootstrap(query, annot)
jacccard_stat, p_value(0.046543092859550536, 0.112)Partition the A-compartments into regions around the edges
from genominterv import interval_collapse, interval_union

df = dataframes['round_spermatid_100kb_arms']

start_edge = pd.DataFrame({
    'chrom': df['chrom'],
    'start': df.apply(lambda x: max(x['start'] - x['resolution'], 0), axis=1),
    'end': df['start']+1*df['resolution'],
    'resolution': df['resolution'],
    'label': 'start_edge'
})
end_edge = pd.DataFrame({
    'chrom': df['chrom'],
    'start': df['end']-1*df['resolution'],
    'end': df.apply(lambda x: min(x['end'] + x['resolution'], chromsizes['chrX']), axis=1),
    'resolution': df['resolution'],
    'label': 'end_edge'
})

# The end cannot exceed the chromosome size
test_df = pd.concat([start_edge, end_edge]).sort_values(['chrom', 'start', 'end'])
interval_collapse(test_df)| start | end | chrom | |
|---|---|---|---|
| 0 | 800000 | 1000000 | chrX |
| 1 | 1500000 | 1800000 | chrX |
| 2 | 2500000 | 2700000 | chrX |
| 3 | 2800000 | 3300000 | chrX |
| 4 | 3400000 | 3600000 | chrX |
| ... | ... | ... | ... |
| 91 | 148700000 | 148900000 | chrX |
| 92 | 149000000 | 149400000 | chrX |
| 93 | 151100000 | 151300000 | chrX |
| 94 | 152400000 | 152600000 | chrX |
| 95 | 153200000 | 153388924 | chrX |
96 rows × 3 columns
import os
from genominterv import interval_collapse

for key, df in dataframes.items():
    outdir = '../results/rec_edges'
    edge_csv_name = os.path.join(outdir,f'{key+'_edges.csv'}')
    if not os.path.exists(edge_csv_name):
        res = df['resolution'].unique()[0]

        start_edge = pd.DataFrame({
            'chrom': df['chrom'],
            'start': df.apply(lambda x: max(x['start'] - x['resolution'], 0), axis=1),
            'end': df['start']+1*df['resolution'],
            'resolution': df['resolution'],
            'label': 'start_edge'
        })
        end_edge = pd.DataFrame({
            'chrom': df['chrom'],
            'start': df['end']-1*df['resolution'],
            'end': df.apply(lambda x: min(x['end'] + x['resolution'], chromsizes['chrX']), axis=1),
            'resolution': df['resolution'],
            'label': 'end_edge'
        })

        if not os.path.exists(outdir):
            os.makedirs(outdir)

        tmp = pd.concat([start_edge, end_edge]).sort_values(['chrom', 'start', 'end'])
        interval_collapse(tmp).assign(resolution=res).to_csv(edge_csv_name, index=False)
Import edges
import pandas as pd
import os

# Directory containing your .csv files
csv_dir = '../results/rec_edges/'

# Create a dictionary to store the DataFrames
edge_df = {}

# Iterate over all .csv files in the directory
for filename in os.listdir(csv_dir):
    if filename.endswith('.csv'):  # Check for .csv files
        # Construct the full file path
        filepath = os.path.join(csv_dir, filename)

        # Load the CSV into a DataFrame
        # Use the filename (without extension) as the dictionary key
        key = filename.replace('_edges_', '')
        key = os.path.splitext(key)[0]
        edge_df[key] = pd.read_csv(filepath)
        edge_df[key]['length'] = edge_df[key]['end'] - edge_df[key]['start']

# The `edges` dictionary now contains the DataFrames
print(edge_df.keys())
print(edge_df['fibroblast_100kb_10Mb_edges'].columns)

#ech90 = pd.read_csv('../data/ech90_human_Mmul_10.csv')
dict_keys(['pachytene_spermatocyte_100kb_arms_smoothed_edges', 'round_spermatid_100kb_arms_smoothed_edges', 'fibroblast_500kb_arms_edges', 'round_spermatid_500kb_10Mb_edges', 'fibroblast_100kb_full_edges', 'round_spermatid_500kb_arms_edges', 'spermatogonia_100kb_arms_smoothed_edges', 'fibroblast_500kb_10Mb_edges', 'round_spermatid_100kb_full_edges', 'spermatogonia_500kb_arms_edges', 'spermatogonia_100kb_full_edges', 'pachytene_spermatocyte_100kb_arms_edges', 'sperm_500kb_full_edges', 'pachytene_spermatocyte_500kb_full_edges', 'sperm_100kb_arms_edges', 'sperm_100kb_arms_smoothed_edges', 'sperm_100kb_10Mb_edges', 'pachytene_spermatocyte_100kb_10Mb_edges', 'fibroblast_100kb_arms_smoothed_edges', 'spermatogonia_500kb_10Mb_edges', 'round_spermatid_100kb_full_smoothed_edges', 'fibroblast_500kb_full_edges', 'round_spermatid_100kb_10Mb_edges', 'pachytene_spermatocyte_100kb_full_smoothed_edges', 'fibroblast_100kb_arms_edges', 'sperm_100kb_10Mb_smoothed_edges', 'round_spermatid_500kb_full_edges', 'fibroblast_100kb_10Mb_edges', 'round_spermatid_100kb_arms_edges', 'fibroblast_100kb_10Mb_smoothed_edges', 'spermatogonia_100kb_full_smoothed_edges', 'spermatogonia_500kb_full_edges', 'spermatogonia_100kb_arms_edges', 'pachytene_spermatocyte_100kb_full_edges', 'sperm_500kb_arms_edges', 'sperm_100kb_full_smoothed_edges', 'pachytene_spermatocyte_100kb_10Mb_smoothed_edges', 'pachytene_spermatocyte_500kb_arms_edges', 'sperm_100kb_full_edges', 'round_spermatid_100kb_10Mb_smoothed_edges', 'spermatogonia_100kb_10Mb_smoothed_edges', 'fibroblast_100kb_full_smoothed_edges', 'pachytene_spermatocyte_500kb_10Mb_edges', 'sperm_500kb_10Mb_edges', 'spermatogonia_100kb_10Mb_edges'])
Index(['start', 'end', 'chrom', 'resolution', 'length'], dtype='object')from genominterv import interval_intersect
samples = dataframes.keys()
#samples = ['round_spermatid_100kb_arms', 'round_spermatid_100kb_10Mb', 'sperm_100kb_arms', 'sperm_100kb_10Mb']
comps = {key:dataframes[key] for key in samples}
edges = {key:edge_df[f'{key}_edges'] for key in samples}
comp_intersects = {key:interval_intersect(comp, ech90).assign(length = lambda x: x['end'] - x['start']) for key, comp in comps.items()}
edge_intersects = {key:interval_intersect(edge, ech90).assign(length = lambda x: x['end'] - x['start']) for key, edge in edges.items()}
## For a single sample only ##
# sample = 'round_spermatid_100kb_arms'
# full_df = dataframes[sample]
# full_intersect = interval_intersect(full_df, ech90).assign(length=lambda x: x['end'] - x['start'])
# edge_intersect = interval_intersect(edge_df[f'{sample}_edges'], ech90).assign(length=lambda x: x['end'] - x['start'])
# edge_df = edge_df[f'{sample}_edges']
# # Plot full
# plot_regions(ech90, full_df, full_intersect)
# plt.suptitle('All edges')
# # Plot edge
# plot_regions(ech90, edge_df, edge_intersect)
# plt.suptitle('Edges only')### Some stats about the data and intersections ###
stats = pd.DataFrame({
'Sample': samples,
'Total regions': [comp.shape[0] for comp in comps.values()],
'Total regions on ECH90': [comp_intersect.shape[0] for comp_intersect in comp_intersects.values()],
'Total regions on edges': [edge_intersect.shape[0] for edge_intersect in edge_intersects.values()],
'Prop regions on ECH90': [comp_intersect.shape[0] / ech90.shape[0] for comp, comp_intersect in zip(comps.values(), comp_intersects.values())],
'Total bp': [comp['length'].sum() for comp in comps.values()],
'Total bp on ECH90': [comp_intersect['length'].sum() for comp_intersect in comp_intersects.values()],
'Total bp on edges': [edge_intersect['length'].sum() for edge_intersect in edge_intersects.values()],
'Prop bp on ECH90': [comp_intersect['length'].sum() / ech90['length'].sum() for comp, comp_intersect in zip(comps.values(), comp_intersects.values())],
})
#df[['Source', 'Rest']] = df['Sample'].str.extract(r'^(.*?)(_\d+\w+.*)')
stats[['source', 'res', 'view', 'smoothed']] = stats['Sample'].str.extract(r'^(.*?)_(100kb|500kb)_(full|arms|10Mb)(?:_(smoothed))?$')
stats['smoothed'] = stats['smoothed'].notna() # Convert to boolean
stats[['source', 'res', 'view', 'smoothed','Prop regions on ECH90', 'Prop bp on ECH90']]
| source | res | view | smoothed | Prop regions on ECH90 | Prop bp on ECH90 | |
|---|---|---|---|---|---|---|
| 0 | spermatogonia | 500kb | arms | False | 0.421053 | 0.489351 |
| 1 | round_spermatid | 500kb | full | False | 0.368421 | 0.418981 |
| 2 | fibroblast | 500kb | full | False | 0.684211 | 0.529916 |
| 3 | pachytene_spermatocyte | 100kb | arms | True | 0.684211 | 0.632145 |
| 4 | pachytene_spermatocyte | 500kb | full | False | 0.368421 | 0.362651 |
| 5 | pachytene_spermatocyte | 100kb | full | False | 0.473684 | 0.365265 |
| 6 | round_spermatid | 100kb | arms | True | 0.631579 | 0.412828 |
| 7 | fibroblast | 100kb | arms | True | 0.684211 | 0.499297 |
| 8 | fibroblast | 100kb | full | False | 0.842105 | 0.550167 |
| 9 | round_spermatid | 100kb | full | False | 0.421053 | 0.472204 |
| 10 | spermatogonia | 100kb | arms | False | 0.526316 | 0.550008 |
| 11 | spermatogonia | 100kb | 10Mb | False | 0.631579 | 0.567910 |
| 12 | sperm | 100kb | full | False | 0.631579 | 0.674746 |
| 13 | sperm | 100kb | arms | True | 0.578947 | 0.572887 |
| 14 | spermatogonia | 500kb | 10Mb | False | 0.684211 | 0.689415 |
| 15 | sperm | 500kb | full | False | 0.631579 | 0.559567 |
| 16 | spermatogonia | 100kb | arms | True | 0.526316 | 0.549381 |
| 17 | pachytene_spermatocyte | 100kb | 10Mb | False | 0.789474 | 0.630109 |
| 18 | round_spermatid | 100kb | 10Mb | False | 0.684211 | 0.519772 |
| 19 | round_spermatid | 100kb | 10Mb | True | 0.578947 | 0.483689 |
| 20 | fibroblast | 100kb | 10Mb | False | 0.684211 | 0.494509 |
| 21 | fibroblast | 100kb | 10Mb | True | 0.526316 | 0.414530 |
| 22 | fibroblast | 100kb | full | True | 0.736842 | 0.591105 |
| 23 | sperm | 100kb | arms | False | 0.736842 | 0.578219 |
| 24 | round_spermatid | 100kb | full | True | 0.368421 | 0.418981 |
| 25 | fibroblast | 500kb | 10Mb | False | 0.473684 | 0.359088 |
| 26 | round_spermatid | 500kb | 10Mb | False | 0.578947 | 0.496303 |
| 27 | sperm | 500kb | arms | False | 0.421053 | 0.395138 |
| 28 | pachytene_spermatocyte | 100kb | 10Mb | True | 0.631579 | 0.665339 |
| 29 | pachytene_spermatocyte | 500kb | 10Mb | False | 0.631579 | 0.538153 |
| 30 | pachytene_spermatocyte | 100kb | full | True | 0.368421 | 0.401552 |
| 31 | round_spermatid | 500kb | arms | False | 0.684211 | 0.655953 |
| 32 | spermatogonia | 500kb | full | False | 0.421053 | 0.392944 |
| 33 | fibroblast | 500kb | arms | False | 0.684211 | 0.550729 |
| 34 | spermatogonia | 100kb | 10Mb | True | 0.631579 | 0.580640 |
| 35 | spermatogonia | 100kb | full | True | 0.368421 | 0.386720 |
| 36 | sperm | 500kb | 10Mb | False | 0.526316 | 0.438818 |
| 37 | pachytene_spermatocyte | 500kb | arms | False | 0.631579 | 0.650289 |
| 38 | pachytene_spermatocyte | 100kb | arms | False | 0.789474 | 0.584619 |
| 39 | sperm | 100kb | 10Mb | True | 0.578947 | 0.549366 |
| 40 | sperm | 100kb | full | True | 0.578947 | 0.677841 |
| 41 | fibroblast | 100kb | arms | False | 0.736842 | 0.510641 |
| 42 | spermatogonia | 100kb | full | False | 0.473684 | 0.374801 |
| 43 | round_spermatid | 100kb | arms | False | 0.789474 | 0.500366 |
| 44 | sperm | 100kb | 10Mb | False | 0.684211 | 0.545798 |
Do testing of the edges
%%capture
# Define what we are testing

print("""
Goal: To test whether ECH90 regions are enriched in compartment edges
Query: ECH90
Annotation: Start and end edges of compartments

Hypothesis:
      ECH90 regions are enriched in compartment edges
Null hypothesis:
      ECH90 regions are not enriched in compartment edges

Tests:
* Proximity test:
      tests whether the query regions are closer to
      the annotation regions than expected by chance.
      NB regions can not overlap, so we need to collapse the annotation regions

* Jaccard index:
      tests the similarity between the query and annotation regions,
      where a value of 1 indicates perfect overlap
""")
Big test don’t run
Parallelized proximity test
set samples = 100_000
import os.path as op
import pandas as pd
from joblib import Parallel, delayed
from tqdm import tqdm
from genominterv.stats import proximity_test
from genominterv import interval_diff


def process_proximity(sample, nsamples = 100000):
    query_comp = ech90
    query_edge = ech90
    annot_comp = comps[sample]
    annot_edge = edges[sample]

    # Get non-overlapping query regions
    non_ovl_query_comp = interval_diff(query_comp, annot_comp)
    non_ovl_query_edge = interval_diff(query_edge, annot_edge)

    proximity_comp = proximity_test(non_ovl_query_comp, annot_comp,
                                    nsamples, two_sided=False,
                                    overlap_as_zero=True)
    proximity_edge = proximity_test(non_ovl_query_edge, annot_edge,
                                    nsamples, two_sided=False,
                                    overlap_as_zero=True,span_as_zero=True)

    results = [
        {'Sample': sample, 'Query': 'ECH90', 'Comp Statistic': proximity_comp.statistic,
         'Edge Statistic': proximity_edge.statistic, 'Comp P-value': proximity_comp.pvalue,
         'Edge P-value': proximity_edge.pvalue}
    ]

    # Swap query and annotation
    query_comp, annot_comp = annot_comp, query_comp
    query_edge, annot_edge = annot_edge, query_edge

    non_ovl_query_comp = interval_diff(query_comp, annot_comp)
    non_ovl_query_edge = interval_diff(query_edge, annot_edge)

    proximity_comp = proximity_test(non_ovl_query_comp, annot_comp,
                                    nsamples, two_sided=False,
                                    overlap_as_zero=True)
    proximity_edge = proximity_test(non_ovl_query_edge, annot_edge,
                                    nsamples, two_sided=False,
                                    overlap_as_zero=True)

    results.append(
        {'Sample': sample, 'Query': 'Edge', 'Comp Statistic': proximity_comp.statistic,
         'Edge Statistic': proximity_edge.statistic, 'Comp P-value': proximity_comp.pvalue,
         'Edge P-value': proximity_edge.pvalue}
    )

    return results

### End of function definition ###


nsamples = 100_000
proximity_file = f'../results/proximity_test_{nsamples}.csv'
if op.exists(proximity_file):
    proximity_res = Parallel(n_jobs=-1)(
        delayed(process_proximity)(sample, nsamples) for sample in tqdm(samples)
    )

    # Flatten the results
    proximity_res = pd.DataFrame([item for sublist in proximity_res for item in sublist])
    proximity_res.to_csv(proximity_file, index=False)
100%|██████████| 2/2 [00:00<00:00, 120.90it/s]--------------------------------------------------------------------------- _RemoteTraceback Traceback (most recent call last) _RemoteTraceback: """ Traceback (most recent call last): File "/home/sojern/miniconda3/envs/hic/lib/python3.12/site-packages/joblib/externals/loky/process_executor.py", line 463, in _process_worker r = call_item() ^^^^^^^^^^^ File "/home/sojern/miniconda3/envs/hic/lib/python3.12/site-packages/joblib/externals/loky/process_executor.py", line 291, in __call__ return self.fn(*self.args, **self.kwargs) ^^^^^^^^^^^^^^^^^^^^^^^^^^^^^^^^^^ File "/home/sojern/miniconda3/envs/hic/lib/python3.12/site-packages/joblib/parallel.py", line 598, in __call__ return [func(*args, **kwargs) ^^^^^^^^^^^^^^^^^^^^^ File "/tmp/ipykernel_2160200/2582913803.py", line 22, in process_proximity TypeError: proximity_test() got an unexpected keyword argument 'span_as_zero' """ The above exception was the direct cause of the following exception: TypeError Traceback (most recent call last) Cell In[15], line 60 58 proximity_file = f'../results/proximity_test_{nsamples}.csv' 59 if op.exists(proximity_file): ---> 60 proximity_res = Parallel(n_jobs=-1)( 61 delayed(process_proximity)(sample, nsamples) for sample in tqdm(samples) 62 ) 64 # Flatten the results 65 proximity_res = pd.DataFrame([item for sublist in proximity_res for item in sublist]) File ~/miniconda3/envs/hic/lib/python3.12/site-packages/joblib/parallel.py:2007, in Parallel.__call__(self, iterable) 2001 # The first item from the output is blank, but it makes the interpreter 2002 # progress until it enters the Try/Except block of the generator and 2003 # reaches the first `yield` statement. This starts the asynchronous 2004 # dispatch of the tasks to the workers. 2005 next(output) -> 2007 return output if self.return_generator else list(output) File ~/miniconda3/envs/hic/lib/python3.12/site-packages/joblib/parallel.py:1650, in Parallel._get_outputs(self, iterator, pre_dispatch) 1647 yield 1649 with self._backend.retrieval_context(): -> 1650 yield from self._retrieve() 1652 except GeneratorExit: 1653 # The generator has been garbage collected before being fully 1654 # consumed. This aborts the remaining tasks if possible and warn 1655 # the user if necessary. 1656 self._exception = True File ~/miniconda3/envs/hic/lib/python3.12/site-packages/joblib/parallel.py:1754, in Parallel._retrieve(self) 1747 while self._wait_retrieval(): 1748 1749 # If the callback thread of a worker has signaled that its task 1750 # triggered an exception, or if the retrieval loop has raised an 1751 # exception (e.g. `GeneratorExit`), exit the loop and surface the 1752 # worker traceback. 1753 if self._aborting: -> 1754 self._raise_error_fast() 1755 break 1757 # If the next job is not ready for retrieval yet, we just wait for 1758 # async callbacks to progress. File ~/miniconda3/envs/hic/lib/python3.12/site-packages/joblib/parallel.py:1789, in Parallel._raise_error_fast(self) 1785 # If this error job exists, immediately raise the error by 1786 # calling get_result. This job might not exists if abort has been 1787 # called directly or if the generator is gc'ed. 1788 if error_job is not None: -> 1789 error_job.get_result(self.timeout) File ~/miniconda3/envs/hic/lib/python3.12/site-packages/joblib/parallel.py:745, in BatchCompletionCallBack.get_result(self, timeout) 739 backend = self.parallel._backend 741 if backend.supports_retrieve_callback: 742 # We assume that the result has already been retrieved by the 743 # callback thread, and is stored internally. It's just waiting to 744 # be returned. --> 745 return self._return_or_raise() 747 # For other backends, the main thread needs to run the retrieval step. 748 try: File ~/miniconda3/envs/hic/lib/python3.12/site-packages/joblib/parallel.py:763, in BatchCompletionCallBack._return_or_raise(self) 761 try: 762 if self.status == TASK_ERROR: --> 763 raise self._result 764 return self._result 765 finally: TypeError: proximity_test() got an unexpected keyword argument 'span_as_zero'
Parallelized Jaccard test
from joblib import Parallel, delayed
from tqdm import tqdm
import os.path as op
from genominterv.stat import jaccard_stat
from genominterv.decorators import bootstrap
from datetime import datetime
import pandas as pd

b = 100_000
@bootstrap(chromsizes, samples=b)
def jaccard_bootstrap(query, annot):
    return jaccard_stat(query, annot)

def process_sample(sample):
    """Function to process a single sample."""
    query_comp = ech90
    query_edge = ech90
    annot_comp = comps[sample]
    annot_edge = edges[sample]

    jaccard_comp = jaccard_bootstrap(query_comp, annot_comp)
    jaccard_edge = jaccard_bootstrap(query_edge, annot_edge)

    result = [{
        'Sample': sample,
        'Query': 'ECH90',
        'Comp Index': jaccard_comp[0],
        'Edge Index': jaccard_edge[0],
        'Comp P-value': jaccard_comp[1],
        'Edge P-value': jaccard_edge[1]
        }
    ]

    # Swap query and annotation for the Edge test
    query_comp, annot_comp = annot_comp, query_comp
    query_edge, annot_edge = annot_edge, query_edge

    jaccard_comp = jaccard_bootstrap(query_comp, annot_comp)
    jaccard_edge = jaccard_bootstrap(query_edge, annot_edge)

    result.append({
        'Sample': sample,
        'Query': 'Edge',
        'Comp Index': jaccard_comp[0],
        'Edge Index': jaccard_edge[0],
        'Comp P-value': jaccard_comp[1],
        'Edge P-value': jaccard_edge[1]
        }
    )
    return result

jaccard_file = f'../results/jaccard_test_{b}.csv'

if not op.exists(jaccard_file):

    # Run parallel computation
    print(f"Running bootstrap ({b}) for all samples in parallel")
    results = Parallel(n_jobs=-1)(
        delayed(process_sample)(sample) for sample in tqdm(samples)
    )

    # Flatten and create DataFrame
    jaccard_res = pd.DataFrame([item for sublist in results for item in sublist])

    # Write to CSV
    jaccard_res.to_csv(jaccard_file, index=False)

else:
    # Read
    jaccard_res = pd.read_csv(jaccard_file)
Plot some summary statistics
# Split sample column:
proximity_res = pd.read_csv(proximity_file)

proximity_res[['source', 'resolution', 'view', 'smoothed']] = proximity_res['Sample'].str.extract(r'^(.*?)_(100kb|500kb)_(full|arms|10Mb)(?:_(smoothed))?$')
proximity_res['source'] = proximity_res['source'].map({'fibroblast':'Fib', 'spermatogonia': 'SP', 'pachytene_spermatocyte': 'PAC', 'round_spermatid': 'RS', 'sperm': 'Sperm'})
proximity_res['smoothed'] = proximity_res['smoothed'].notna()
proximity_res['resolution'] = proximity_res.apply(lambda x: 'ps500kb' if x['smoothed'] else x['resolution'], axis=1)
proximity_res = proximity_res.melt(
    id_vars=['Sample', 'source', 'resolution', 'view', 'Query'],
    value_vars=['Comp P-value', 'Edge P-value'],
     var_name='type', value_name='p-value',).query('Query == "ECH90"')
import matplotlib.pyplot as plt
import numpy as np
import seaborn as sns
source_order = ['Fib', 'SP', 'PAC', 'RS', 'Sperm']
# Choose the combination og parameters to plot
source = ['fibroblast','round_spermatid']
res = ['100kb']
view = ['arms']
annot = ['Edge P-value']
# Plot the results from @group
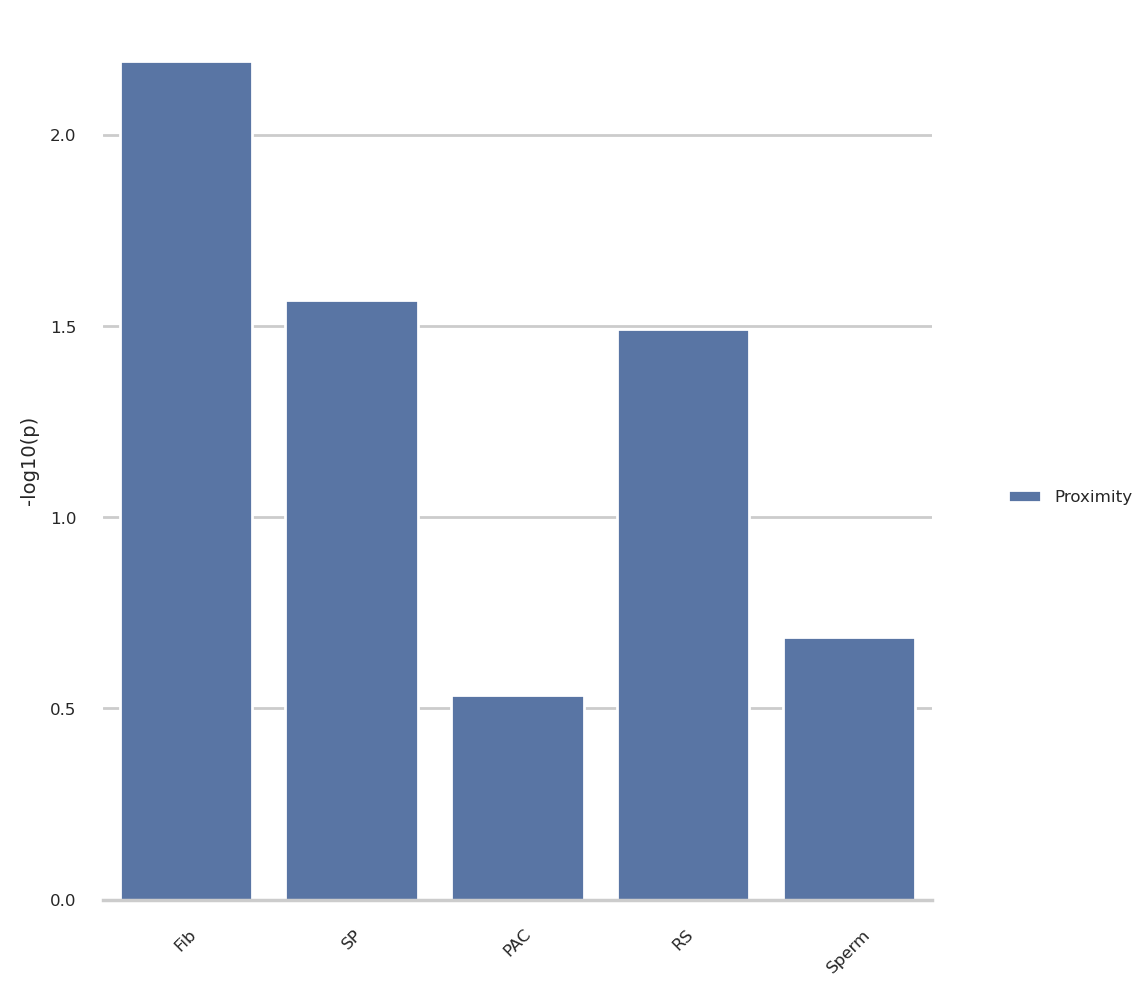
plot_group_prox = proximity_res.query('resolution in @res and view in @view and type in @annot')
plot_group_prox = plot_group_prox.assign(
minuslog10p = lambda x: -np.log10(x['p-value']),
type = 'Proximity')
# Plot the results
sns.set_theme(style="whitegrid", rc=notebook_rcparams)
g = sns.catplot(
plot_group_prox, kind='bar',
x='source', y='minuslog10p', hue='type',
order=source_order,
errorbar=None, margin_titles=True, sharex=False,
)
g.despine(left=True)
g.set_axis_labels("", "-log10(p)")
g.legend.set_title('')
for axis in g.axes.flat:
axis.tick_params(labelbottom=True)
# rotate said labels
for item in axis.get_xticklabels():
item.set_rotation(45)
g.tight_layout()
# Now do the same for the Jaccard index

jaccard_res = pd.read_csv(jaccard_file)

jaccard_res[['source', 'resolution', 'view', 'smoothed']] = jaccard_res['Sample'].str.extract(r'^(.*?)_(100kb|500kb)_(full|arms|10Mb)(?:_(smoothed))?$')
jaccard_res['source'] = jaccard_res['source'].map({'fibroblast':'Fib', 'spermatogonia': 'SP', 'pachytene_spermatocyte': 'PAC', 'round_spermatid': 'RS', 'sperm': 'Sperm'})
jaccard_res['smoothed'] = jaccard_res['smoothed'].notna()
jaccard_res['resolution'] = jaccard_res.apply(lambda x: 'ps500kb' if x['smoothed'] else x['resolution'], axis=1)
jaccard_res = jaccard_res.melt(
    id_vars=['Sample', 'source', 'resolution', 'view', 'Query'],
    value_vars=['Comp P-value', 'Edge P-value'],
    var_name='type', value_name='p-value',).query('Query == "ECH90"')
import numpy as np

source_order = ['Fib', 'SP', 'PAC', 'RS', 'Sperm']
# Choose the combination og parameters to plot
source = ['fibroblast','round_spermatid']
res = ['100kb']
view = ['arms']
annot = ['Edge P-value']

# Plot the results from @group
plot_group_jacc = jaccard_res.query('resolution in @res and view in @view and type in @annot')
plot_group_jacc = plot_group_jacc.assign(
    minuslog10p = lambda x: -np.log10(x['p-value']),
    type = 'Jaccard')

# Plot the results

sns.set_theme(style="whitegrid", rc=notebook_rcparams)

g = sns.catplot(
    plot_group_jacc, kind='bar',
    x='source', y='minuslog10p', hue='type',
    order=source_order,
    errorbar=None, margin_titles=True, sharex=False,
    )

g.despine(left=True)
g.set_axis_labels("", "-log10(p)")
g.legend.set_title('')


for axis in g.axes.flat:
    axis.tick_params(labelbottom=True)
    # rotate said labels
    for item in axis.get_xticklabels():
        item.set_rotation(45)

g.tight_layout()
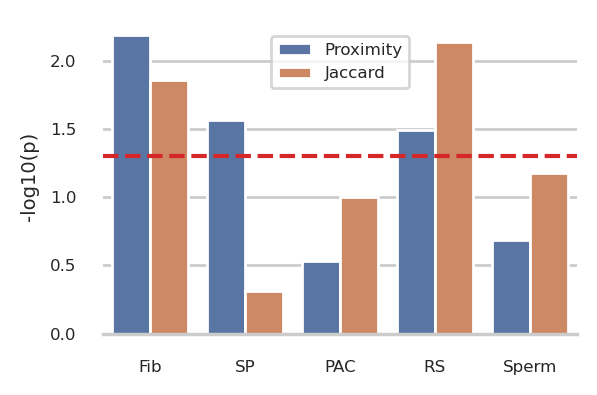
Plot proximity result with Jaccard result
# Concatenate the two plot_groups

group = pd.concat([plot_group_prox, plot_group_jacc])
# display(group[['source', 'resolution', 'type', 'p-value', 'minuslog10p']].query(
#     'source in ("Fib", "RS")'
# ).reset_index(drop=True))

# g = sns.catplot(
#     group, kind='bar',
#     x='source', y='minuslog10p', hue='type',
#     order=source_order,
#     errorbar=None, margin_titles=True,
#     height=2, aspect=1.5
#     )
# # Plot a horisontal line at p=0.05
# g.ax.axhline(-np.log10(0.05), color='tab:red', linestyle='--')

f,ax = plt.subplots(figsize=(3,2))

# barplot
g = sns.barplot(
    data=group, x='source', y='minuslog10p', hue='type',
    order=source_order, ax = ax
    )

ax.axhline(-np.log10(0.05), color='tab:red', linestyle='--')


sns.despine(ax=g, left=True)

g.set_ylabel('-log10(p)')
g.set_xlabel('')
g.get_legend().set_title('')
sns.move_legend(g, 'upper center', bbox_to_anchor=(0.5,0.975))

f.tight_layout()
plt.show()
Plot all cominations of the parameters
Avoid this to avoid p-hacking.
# # Define the order of the x-axis if we plot all combinations
# view_order = ['full', 'arms', '10Mb']
# row_order = ['Fib', 'SP', 'PAC', 'RS', 'Sperm']
#
# sns.set_theme(style="whitegrid")
#
# g = sns.catplot(
#     proximity_res, kind='bar', row='source',
#     x='view', y='p-value', hue='type', col='resolution',
#     order=view_order, row_order=row_order,
#     errorbar=None, margin_titles=True, sharex=False,
#     )
#
# g.despine(left=True)
# g.set_axis_labels("", "P-value")
# g.legend.set_title('')
#
#
# for axis in g.axes.flat:
#     axis.tick_params(labelbottom=True)
#     # rotate said labels
#     for item in axis.get_xticklabels():
#         item.set_rotation(45)
#
# g.tight_layout()
# # # Group the results by source and resolution
# # group = ["fibroblast", 'round_spermatid']
# # # Plot the results from @group
# # plot_group = jaccard_res.query(f'source in @group')
# sns.set_theme(style="whitegrid")

# view_order = ['full', 'arms', '10Mb']
# row_order = ['Fib', 'SP', 'PAC', 'RS', 'Sperm']

# g = sns.catplot(
#     jaccard_res, kind='bar', row='source',
#     x='view', y='p-value', hue='type', col='resolution',
#     margin_titles=True, sharex=False,
#     order=view_order, row_order=row_order,
#     errorbar=None)

# g.despine(left=True)
# g.set_axis_labels("", "P-value")
# g.legend.set_title('')
# for axis in g.axes.flat:
#     axis.tick_params(labelbottom=True)
#     # rotate said labels
#     for item in axis.get_xticklabels():
#         item.set_rotation(45)
#         item.set_va('top')

# g.tight_layout()
Revised test (baboon)
Baboon data
Here, the data for hybrid incompatibility in baboons (having Papio hamadryas or Papio anubis ancestry) is introduced and compared with the edge regions of the compartments. The intervals are extracted from baboondiversity project, in the notebook baboon_ancestry_segments.ipynb.
The data originates from a baboon population in a hybridization zone between olive and hamadryas baboons, and the extracted intervals are genomic regions where (almost) all individiuals have the same ancestral allele, 100% from olive or 95% hamadryas. It has nothing to do with Hi-C data, but maybe the intervals align as well?
The intervals were lifted to rheMac10 via hg38: panu_3.0 -> hg38 -> rheMac10: two intervals were deleted with no match in the last step:
#Deleted in new
chrX    58600000    58700000    high_olive
#Deleted in new
chrX    59400000    60800000    high_olive
Additionally, 4 intervals were lifted to the Y chromosome, so they were deleted as well
The tests
We think the regions where hamadryas ancestry is preserved are the most relevant to this analysis, as the regions are shorter and there are not as many.
Here, perform the tests as discussed (meeting)
Edge.v.Edge: (100kb +/- start,end)
jaccard_testquery: [ech, high_hama]annot: [rs100_arms_edge, fb100_arms_edge]- Total tests: \(4\)
proximity_test(overlap_as_zero=True,span_as_zero=True)query: [ech, high_hama]annot: [rs100_arms_edge, fb100_arms_edge]- Total tests: \(4\)
Region.v.Region
jaccard_bootstrap()query: [ech, high_hama]annot: [rs100_arms_comp, fb100_arms_comp]
Load baboons
# Load baboons, define only high_hama

import pandas as pd
from genominterv import interval_collapse


### Lifted with standard UCSC LiftOver
# baboon_df = pd.read_csv('../results/high_baboon_rhemac10.bed', sep='\t', index_col=False, header=None, names=['chrom', 'start', 'end', 'group', 'score'])
baboon_nonlift = pd.read_csv('../results/hama_olive_high_intervals.tsv', sep='\t', index_col=False)

# # print("Original:")
# # print(baboon_df.groupby('group').size())

# high_hama = (interval_collapse(baboon_df.query('group == "high_hama"')).
#              assign(group = "high_hama").
#              query('chrom == "chrX"')
#              ).reset_index(drop=True)
# high_olive = (interval_collapse(baboon_df.query('group == "high_olive"')).
#               assign(group = "high_olive").
#               query('chrom == "chrX"')
#               )
# print("\nCollapsed:")
# #print(pd.concat([high_hama, high_olive]).groupby('group').size())


# #baboon_dict = {"P.hama": high_hama, "P.anubis": high_olive}
# print(f"high_hama: {high_hama.shape[0]}")

### Lifted with  segment_liftover (`lift` env)

high_hama = pd.read_csv('../data/lift/rheMac10/high_hama_rhemac10.bed', sep='\t', index_col=False, header=None, names=['group', 'chrom', 'start', 'end'])

high_olive = pd.read_csv('../data/lift/rheMac10/high_olive_rhemac10.bed', sep='\t', index_col=False, header=None, names=['group', 'chrom', 'start', 'end'])
Define functions
from genominterv import interval_collapse
from multiprocessing import cpu_count
from genominterv.stats import jaccard_stat, proximity_stat
from genominterv.decorators import bootstrap
import numpy as np
import pandas as pd

# Make edges function

## Make a function that splits an interval into its edges (and collapses overlapping edges)

def make_edges(df, resolution):
    start_edge = pd.DataFrame({
        'chrom': df['chrom'],
        'start': df.apply(lambda x: max(x['start'] - resolution, 0), axis=1),
        'end': df['start']+1*resolution,
        'resolution': resolution,
    })
    end_edge = pd.DataFrame({
        'chrom': df['chrom'],
        'start': df['end']-1*resolution,
        'end': df.apply(lambda x: min(x['end'] + resolution, chromsizes['chrX']), axis=1),
        'resolution': resolution,
    })

    return interval_collapse(pd.concat([start_edge, end_edge]).sort_values(['chrom', 'start', 'end'])).assign(resolution=resolution)


nsamples=100_000

@bootstrap(chromsizes, samples=nsamples)
def proximity_test(q, a):
    """
    Tests if the mean relative distance of query segments to the
    closest annotation is smaller than expected.
    """
    return proximity_stat(q, a)

@bootstrap(chromsizes, samples=nsamples)
def jaccard_test(q, a):
    """"
    Tests if the overlap between query and annotation segments
    is smaller than expected.
    """
    return jaccard_stat(q, a)

def overlaps(df1, df2):
    """
    Establishes whether each query segment overlaps at least one
    annotation segment. Returns a boolean array with same length
    as df1.index.
    """
    overlapping = []
    for i, (s1, e1) in enumerate(zip(df1.start, df1.end)):
        overlaps = False
        for s2, e2 in zip(df2.start, df2.end):
            if e1 > s2 and e2 > s1:
                overlaps = True
                break
        overlapping.append(overlaps)
    return np.array(overlapping)

def svedig_tabel(orig_df, index, columns, values, cmap='Reds'):
    df = (orig_df
        .assign(log10p=np.log10(results.p))
        .loc[(results.p < 0.05)]
        .pivot(index=index, columns=columns, values=values)
    )
    df = df.rename(columns = {x:x.replace('_', '<br>') for x in df.columns.tolist()})
    df = (df.style
        .background_gradient(subset=df.columns, axis=None, cmap=cmap, vmin=0)
        .map(lambda x: 'color: transparent; background-color: transparent' if np.isnan(x) else '')
        .format('{:.3f}')
        .set_table_styles(
                {c: [{'selector': '',
                        'props': [('min-width', '100px')],
                        }] for c in df.columns}, overwrite=False
        )
    )
    return df
Load comps and edges
# Define the rest and get an overview of the selected samples

samples = ['fibroblast_100kb_arms', 'round_spermatid_100kb_arms']

fb100_dict = {
    'full':dataframes[samples[0]],
    'edges':make_edges(dataframes[samples[0]], 100_000),
    'limits': make_edges(dataframes[samples[0]], 1)}

rs100_dict = {
    'full':dataframes[samples[1]],
    'edges':edge_df[f'{samples[1]}_edges'],
    'limits': make_edges(dataframes[samples[1]], 1)}

hama_dict = {
    'full': high_hama,
    'edges': make_edges(high_hama, 100_000),
    'limits': make_edges(high_hama, 1)
}

olive_dict = {
    'full': high_olive,
    'edges': make_edges(high_olive, 100_000),
    'limits': make_edges(high_olive, 1)
}

hamaolive_dict = {
    'full': pd.concat([high_hama, high_olive]),
    'edges': make_edges(pd.concat([high_hama, high_olive]), 100_000),
    'limits': make_edges(pd.concat([high_hama, high_olive]), 1)
}

ech_dict = {'full': ech90,
            'edges': make_edges(ech90, 100_000),
            'limits': make_edges(ech90, 1)}
Summarise
# Summarise how much the edges are reduced compared to the full regions

names = ['Fibroblast', 'Round spermatid', 'Hamadryas', 'Olive', 'HamaOlive', 'ECH']
samples = [fb100_dict, rs100_dict, hama_dict, olive_dict, hamaolive_dict, ech_dict]

#

summary = pd.DataFrame({
    'Sample': names,
    'Full_bp': [sum(sample['full']['end'] - sample['full']['start']) for sample in samples],
    'full_max_bp': [max(sample['full']['end'] - sample['full']['start']) for sample in samples],
    'full_avg_bp': [round(sum(sample['full']['end'] - sample['full']['start']) / sample['full'].shape[0], 1) for sample in samples],
    'full_min_bp': [min(sample['full']['end'] - sample['full']['start']) for sample in samples],
    'Edge_bp': [sum(sample['edges']['end'] - sample['edges']['start']) for sample in samples],
    'edge_avg_bp': [round(sum(sample['edges']['end'] - sample['edges']['start']) / sample['edges'].shape[0], 1) for sample in samples],

}).assign(edge_over_full=lambda x: round(x['Edge_bp'] / x['Full_bp'],3))

# tell pandas to use thousands separator
display(summary.style
        .format("{:,.0f}", subset=['Full_bp', 'full_max_bp', 'full_min_bp', 'Edge_bp'])
        .format("{:,.1f}", subset=['full_avg_bp', 'edge_avg_bp'])
        .format("{:.1%}", subset='edge_over_full')
        )

plot_regions(high_olive, high_hama, ech90,
             track_titles=['Hama', 'Olive', 'ECH90'],
             title="Edges")

plot_regions(high_olive,baboon_nonlift.query('group == "high_olive"'),
             track_titles=['Lifted High olive', 'Non-lifted high olive'],
             title="Compare liftOver")

plot_regions(hama_dict['limits'], olive_dict['limits'], ech_dict['limits'],
             track_titles=['Hama', 'Olive', 'ECH90'],
             title='Limits',
             alpha=1, lw=0.3)

plot_regions(olive_dict['limits'], fb100_dict['limits'], rs100_dict['limits'],
             track_titles=['Hama', 'Fibroblast', 'Round spermatid'],
             title='Limits',
             alpha=1, lw=0.3)
| Sample | Full_bp | full_max_bp | full_avg_bp | full_min_bp | Edge_bp | edge_avg_bp | edge_over_full | |
|---|---|---|---|---|---|---|---|---|
| 0 | Fibroblast | 64,200,000 | 5,000,000 | 1,088,135.6 | 100,000 | 21,600,000 | 260,241.0 | 33.6% |
| 1 | Round spermatid | 56,500,000 | 4,500,000 | 733,766.2 | 100,000 | 27,088,924 | 282,176.3 | 47.9% |
| 2 | Hamadryas | 8,775,834 | 1,787,836 | 516,225.5 | 96,276 | 6,434,612 | 229,807.6 | 73.3% |
| 3 | Olive | 44,876,120 | 6,493,293 | 1,319,885.9 | 97,613 | 12,715,662 | 219,235.6 | 28.3% |
| 4 | HamaOlive | 53,651,954 | 6,493,293 | 1,051,999.1 | 96,276 | 18,941,689 | 228,213.1 | 35.3% |
| 5 | ECH | 5,511,675 | 623,108 | 290,088.2 | 88,572 | 7,195,159 | 224,848.7 | 130.5% |


Test
Test revised I
# Now define tests
from genominterv.decorators import bootstrap
from genominterv.stats import proximity_test, jaccard_stat
from joblib import Parallel, delayed
from tqdm import tqdm

n_samples=100_000

## Proximity test

def proximity_parallel(query, annot, nsamples=100_000, oaz=False, saz=False):
    q_key, a_key = query, annot
    query = prox_dict[q_key]
    annot = prox_dict[a_key]

    test = proximity_test(query, annot, nsamples,
                          overlap_as_zero=oaz,
                          span_as_zero=saz
                          )

    results = [
        {'Query': q_key,
         'Annot': a_key,
         'Statistic': test.statistic,
         'P-value': test.pvalue,
         'Overlap as zero': oaz,
         'Span as zero': saz
         }
    ]

    return results

## Jaccard bootstrap
@bootstrap(chromsizes, samples=10_000)
def jaccard_bootstrap(query, annot):
    return jaccard_stat(query, annot)

def jaccard_parallel(query, annot):
    q_key = query
    a_key = annot
    query = jacc_dict[q_key]
    annot = jacc_dict[a_key]

    test = jaccard_bootstrap(query, annot)

    results = [
        {'Query': q_key,
            'Annot': a_key,
            'Index': test[0],
            'P-value': test[1]
            }]
    return results

# Now do the testing
# Define the samples
prox_dict = {'ECH90': ech_dict['full'],
             'Hamadryas': hama_dict['full'],
             'Olive': olive_dict['full'],
             'Fib100_edge': fb100_dict['edges'],
             'RS100_edge': rs100_dict['edges'],
             'RS100_full': rs100_dict['full']
            }

prox_samples = [('ECH90', 'Fib100_edge', n_samples),
                ('ECH90', 'RS100_edge', n_samples),
                ('Hamadryas', 'Fib100_edge', n_samples),
                ('Hamadryas', 'RS100_edge', n_samples),
                ('Olive', 'Fib100_edge', n_samples),
                ('Olive', 'RS100_edge', n_samples),
                ('Olive', 'RS100_full', n_samples),
                ('Hamadryas', 'RS100_full', n_samples),
                ]

# First, without oaz, saz
proximity_res1 = Parallel(n_jobs=-1)(
    delayed(proximity_parallel)(que, ann, n, False, False) for (que,ann,n) in tqdm(prox_samples)
)
proximity_res1 = pd.DataFrame([item for sublist in proximity_res1 for item in sublist])

# Now with oaz, saz
proximity_res2 = Parallel(n_jobs=-1)(
    delayed(proximity_parallel)(que, ann, n, True, True) for (que,ann,n) in tqdm(prox_samples)
)
proximity_res2 = pd.DataFrame([item for sublist in proximity_res2 for item in sublist])

# Now with oaz, saz
proximity_res3 = Parallel(n_jobs=-1)(
    delayed(proximity_parallel)(que, ann, n, True, False) for (que,ann,n) in tqdm(prox_samples)
)
proximity_res3 = pd.DataFrame([item for sublist in proximity_res3 for item in sublist])


# Concatenate the results
proximity_res = pd.concat([proximity_res1, proximity_res2, proximity_res3])

# Write to CSV
#proximity_res.to_csv('../results/proximity_revised.csv', index=False)

# Now do the Jaccard index
jacc_samples = [(ech_dict['full'], fb100_dict['full']),
                (hama_dict['full'], rs100_dict['full'])
                ]

jacc_dict = {'ECH90': ech_dict['full'],
             'Hamadryas': hama_dict['full'],
             'Olive': olive_dict['full'],
             'Fib100_edge': fb100_dict['edges'],
             'Fib100_full': fb100_dict['full'],
             'RS100_full': rs100_dict['full'],
             'RS100_edge': rs100_dict['edges']
            }
jacc_samples = [
    ('ECH90', 'Fib100_full'),
    ('ECH90', 'Fib100_edge'),
    ('ECH90', 'RS100_full'),
    ('ECH90', 'RS100_edge'),
    ('Hamadryas', 'Fib100_full'),
    ('Hamadryas', 'Fib100_edge'),
    ('Hamadryas', 'RS100_full'),
    ('Hamadryas', 'RS100_edge'),
    ('Olive', 'Fib100_edge'),
    ('Olive', 'RS100_edge'),
    ]

jaccard_res = Parallel(n_jobs=-1)(
    delayed(jaccard_parallel)(que, ann) for (que,ann) in tqdm(jacc_samples)
)

# Flatten and create DataFrame
jaccard_res = pd.DataFrame([item for sublist in jaccard_res for item in sublist])

# Write to CSV
#jaccard_res.to_csv('../results/jaccard_revised.csv', index=False)
100%|██████████| 8/8 [00:00<00:00, 395.88it/s]--------------------------------------------------------------------------- KeyboardInterrupt Traceback (most recent call last) Cell In[15], line 75 64 prox_samples = [('ECH90', 'Fib100_edge', n_samples), 65 ('ECH90', 'RS100_edge', n_samples), 66 ('Hamadryas', 'Fib100_edge', n_samples), (...) 71 ('Hamadryas', 'RS100_full', n_samples), 72 ] 74 # First, without oaz, saz ---> 75 proximity_res1 = Parallel(n_jobs=-1)( 76 delayed(proximity_parallel)(que, ann, n, False, False) for (que,ann,n) in tqdm(prox_samples) 77 ) 78 proximity_res1 = pd.DataFrame([item for sublist in proximity_res1 for item in sublist]) 80 # Now with oaz, saz File ~/miniconda3/envs/hic/lib/python3.12/site-packages/joblib/parallel.py:2007, in Parallel.__call__(self, iterable) 2001 # The first item from the output is blank, but it makes the interpreter 2002 # progress until it enters the Try/Except block of the generator and 2003 # reaches the first `yield` statement. This starts the asynchronous 2004 # dispatch of the tasks to the workers. 2005 next(output) -> 2007 return output if self.return_generator else list(output) File ~/miniconda3/envs/hic/lib/python3.12/site-packages/joblib/parallel.py:1650, in Parallel._get_outputs(self, iterator, pre_dispatch) 1647 yield 1649 with self._backend.retrieval_context(): -> 1650 yield from self._retrieve() 1652 except GeneratorExit: 1653 # The generator has been garbage collected before being fully 1654 # consumed. This aborts the remaining tasks if possible and warn 1655 # the user if necessary. 1656 self._exception = True File ~/miniconda3/envs/hic/lib/python3.12/site-packages/joblib/parallel.py:1762, in Parallel._retrieve(self) 1757 # If the next job is not ready for retrieval yet, we just wait for 1758 # async callbacks to progress. 1759 if ((len(self._jobs) == 0) or 1760 (self._jobs[0].get_status( 1761 timeout=self.timeout) == TASK_PENDING)): -> 1762 time.sleep(0.01) 1763 continue 1765 # We need to be careful: the job list can be filling up as 1766 # we empty it and Python list are not thread-safe by 1767 # default hence the use of the lock KeyboardInterrupt:
display('Proximity:',proximity_res.sort_values(['Query', 'Annot','Overlap as zero']),
'Jaccard:',jaccard_res)'Proximity:'| Query | Annot | Statistic | P-value | Overlap as zero | Span as zero | |
|---|---|---|---|---|---|---|
| 0 | ECH90 | Fib100_edge | 0.126462 | 0.18750 | False | False |
| 0 | ECH90 | Fib100_edge | 0.320105 | 0.00000 | True | True |
| 0 | ECH90 | Fib100_edge | 0.320105 | 0.00000 | True | False |
| 1 | ECH90 | RS100_edge | -0.051091 | 0.85932 | False | False |
| 1 | ECH90 | RS100_edge | 0.412667 | 0.00000 | True | True |
| 1 | ECH90 | RS100_edge | 0.383300 | 0.00000 | True | False |
| 2 | Hamadryas | Fib100_edge | 0.010583 | 0.49535 | False | False |
| 2 | Hamadryas | Fib100_edge | 0.121857 | 0.00057 | True | True |
| 2 | Hamadryas | Fib100_edge | 0.121857 | 0.32055 | True | False |
| 3 | Hamadryas | RS100_edge | 0.043037 | 0.46991 | False | False |
| 3 | Hamadryas | RS100_edge | 0.079267 | 0.10159 | True | True |
| 3 | Hamadryas | RS100_edge | 0.079267 | 0.00830 | True | False |
| 7 | Hamadryas | RS100_full | -0.038111 | 0.67801 | False | False |
| 7 | Hamadryas | RS100_full | 0.065700 | 0.55859 | True | True |
| 7 | Hamadryas | RS100_full | 0.065700 | 0.32201 | True | False |
| 4 | Olive | Fib100_edge | 0.267519 | 0.00000 | False | False |
| 4 | Olive | Fib100_edge | 0.281078 | 0.00000 | True | True |
| 4 | Olive | Fib100_edge | 0.277333 | 0.00000 | True | False |
| 5 | Olive | RS100_edge | 0.137642 | 0.00000 | False | False |
| 5 | Olive | RS100_edge | 0.156492 | 0.00000 | True | True |
| 5 | Olive | RS100_edge | 0.156492 | 0.00000 | True | False |
| 6 | Olive | RS100_full | 0.179701 | 0.00000 | False | False |
| 6 | Olive | RS100_full | 0.197664 | 0.00000 | True | True |
| 6 | Olive | RS100_full | 0.185778 | 0.00000 | True | False |
'Jaccard:'| Query | Annot | Index | P-value | |
|---|---|---|---|---|
| 0 | ECH90 | Fib100_full | 0.042072 | 0.1962 |
| 1 | ECH90 | Fib100_edge | 0.063394 | 0.0141 |
| 2 | ECH90 | RS100_full | 0.046543 | 0.1005 |
| 3 | ECH90 | RS100_edge | 0.062911 | 0.0121 |
| 4 | Hamadryas | Fib100_full | 0.032936 | 0.2989 |
| 5 | Hamadryas | Fib100_edge | 0.015783 | 0.7405 |
| 6 | Hamadryas | RS100_full | 0.031271 | 0.3467 |
| 7 | Hamadryas | RS100_edge | 0.022037 | 0.5719 |
| 8 | Olive | Fib100_edge | 0.039584 | 0.7753 |
| 9 | Olive | RS100_edge | 0.039312 | 0.8489 |
Test revised II
Kasper realized it is very hard to capture both proximity and intersect in the same statistic. Thus, we go back to test the overlapping regions with Jaccard test, and use a new proximity test, measuring the mean distance between query regions and annotation regions, almost with the same power as the previous one.
### Test the functions ### took 25 seconds for nsamples=100_000

query = olive_dict['limits']
annot = make_edges(dataframes['sperm_100kb_10Mb'], 5)

stat, p = jaccard_test(query, annot)
print(f'''
Jaccard overlap test:
    stat: {stat}
       p: {p}
''')

query_non_ovl = query.loc[~overlaps(query, annot)]
stat, p = proximity_test(query_non_ovl, annot)
print(f'''
Proximity test:
    stat: {stat}
       p: {p}
''')
Jaccard overlap test:
    stat: 0.0013218770654329147
       p: 0.00053


Proximity test:
    stat: 0.2930268116279996
       p: 0.00929
### Make it a loop in stead
a_names = ['Fb100arms_edge', 'RS100arms_edge',
           'Fb100_10Mb_edge', 'RS100_10Mb_edge',
           'Fb100arms_full', 'RS100arms_full']
q_names = ['ECH', 'Hama', 'Olive',
           'ECH_edge', 'Hama_edge', 'Olive_edge']

annots = [edge_df['fibroblast_100kb_arms_edges'], edge_df['round_spermatid_100kb_arms_edges'],
          edge_df['fibroblast_100kb_10Mb_edges'], edge_df['round_spermatid_100kb_10Mb_edges'],
          dataframes['fibroblast_100kb_arms'], dataframes['round_spermatid_100kb_arms']]
queries = [ech_dict['full'], hama_dict['full'], olive_dict['full'],
            ech_dict['edges'], hama_dict['edges'], olive_dict['edges']]

results = pd.DataFrame({
    'Query': [],
    'Annotation': [],
    'Jaccard Index': [],
    'Jaccard P-value': [],
    'Proximity Statistic': [],
    'Proximity P-value': []
})

for i,query in enumerate(queries):
    print(f'i = {i}')
    for j,annot in enumerate(annots):
        print(f'j = {j}')
        j_stat, j_p = jaccard_test(query, annot)
        query_non_ovl = query.loc[~overlaps(query, annot)]
        p_stat, p_p = proximity_test(query_non_ovl, annot)
        tmp = pd.DataFrame(
            {
            'Query': q_names[i],
            'Annotation': a_names[j],
            'Jaccard Index': j_stat,
            'Jaccard P-value': j_p,
            'Proximity Statistic': p_stat,
            'Proximity P-value': p_p
            },
            index=[0])
        results = pd.concat([results, tmp], ignore_index=True)

results
i = 0
j = 0
j = 1
j = 2
j = 3
j = 4
j = 5
i = 1
j = 0
j = 1
j = 2
j = 3
j = 4
j = 5
i = 2
j = 0
j = 1
j = 2
j = 3
j = 4
j = 5
i = 3
j = 0
j = 1
j = 2
j = 3
j = 4
j = 5
i = 4
j = 0
j = 1
j = 2
j = 3
j = 4
j = 5
i = 5
j = 0
j = 1
j = 2
j = 3
j = 4
j = 5| Query | Annotation | Jaccard Index | Jaccard P-value | Proximity Statistic | Proximity P-value | |
|---|---|---|---|---|---|---|
| 0 | ECH | Fb100arms_edge | 0.063394 | 0.01234 | 0.281690 | 0.31470 |
| 1 | ECH | RS100arms_edge | 0.062911 | 0.01029 | 0.237249 | 0.61862 |
| 2 | ECH | Fb100_10Mb_edge | 0.048480 | 0.08578 | 0.221680 | 0.73127 |
| 3 | ECH | RS100_10Mb_edge | 0.057965 | 0.02468 | 0.280611 | 0.33594 |
| 4 | ECH | Fb100arms_full | 0.042072 | 0.19746 | 0.188639 | 0.40612 |
| 5 | ECH | RS100arms_full | 0.046543 | 0.10295 | 0.277032 | 0.39865 |
| 6 | Hama | Fb100arms_edge | 0.021886 | 0.90170 | 0.253639 | 0.51690 |
| 7 | Hama | RS100arms_edge | 0.027870 | 0.85085 | 0.256731 | 0.50018 |
| 8 | Hama | Fb100_10Mb_edge | 0.031809 | 0.75087 | 0.253548 | 0.51142 |
| 9 | Hama | RS100_10Mb_edge | 0.034824 | 0.72564 | 0.298500 | 0.39744 |
| 10 | Hama | Fb100arms_full | 0.059582 | 0.33048 | 0.255948 | 0.65396 |
| 11 | Hama | RS100arms_full | 0.069205 | 0.15910 | 0.242701 | 0.43243 |
| 12 | Olive | Fb100arms_edge | 0.109276 | 0.39990 | 0.279857 | 0.27209 |
| 13 | Olive | RS100arms_edge | 0.139396 | 0.23299 | 0.239110 | 0.65271 |
| 14 | Olive | Fb100_10Mb_edge | 0.082725 | 0.93293 | 0.252348 | 0.52897 |
| 15 | Olive | RS100_10Mb_edge | 0.146962 | 0.17601 | 0.242756 | 0.61343 |
| 16 | Olive | Fb100arms_full | 0.281681 | 0.03051 | 0.272324 | 0.56266 |
| 17 | Olive | RS100arms_full | 0.209506 | 0.32056 | 0.235625 | 0.71433 |
| 18 | ECH_edge | Fb100arms_edge | 0.076356 | 0.00404 | 0.295478 | 0.18026 |
| 19 | ECH_edge | RS100arms_edge | 0.062408 | 0.03379 | 0.266103 | 0.38942 |
| 20 | ECH_edge | Fb100_10Mb_edge | 0.057708 | 0.06767 | 0.269624 | 0.34382 |
| 21 | ECH_edge | RS100_10Mb_edge | 0.074277 | 0.00498 | 0.273560 | 0.35419 |
| 22 | ECH_edge | Fb100arms_full | 0.051794 | 0.18634 | 0.295836 | 0.50053 |
| 23 | ECH_edge | RS100arms_full | 0.054435 | 0.11747 | 0.274170 | 0.81663 |
| 24 | Hama_edge | Fb100arms_edge | 0.014028 | 0.95055 | 0.240012 | 0.64811 |
| 25 | Hama_edge | RS100arms_edge | 0.033281 | 0.54103 | 0.244095 | 0.60123 |
| 26 | Hama_edge | Fb100_10Mb_edge | 0.029314 | 0.63328 | 0.262847 | 0.40403 |
| 27 | Hama_edge | RS100_10Mb_edge | 0.044633 | 0.21629 | 0.234146 | 0.67565 |
| 28 | Hama_edge | Fb100arms_full | 0.053583 | 0.05438 | 0.191426 | 0.12090 |
| 29 | Hama_edge | RS100arms_full | 0.061216 | 0.00873 | 0.200406 | 0.12220 |
| 30 | Olive_edge | Fb100arms_edge | 0.038987 | 0.87121 | 0.250063 | 0.54679 |
| 31 | Olive_edge | RS100arms_edge | 0.049514 | 0.75761 | 0.257123 | 0.43135 |
| 32 | Olive_edge | Fb100_10Mb_edge | 0.057027 | 0.47526 | 0.257397 | 0.42551 |
| 33 | Olive_edge | RS100_10Mb_edge | 0.051652 | 0.71941 | 0.243567 | 0.64567 |
| 34 | Olive_edge | Fb100arms_full | 0.079507 | 0.32217 | 0.258289 | 0.46750 |
| 35 | Olive_edge | RS100arms_full | 0.071486 | 0.51011 | 0.237859 | 0.67702 |
subset_annot = ['RS100arms_edge', 'RS100_10Mb_edge',
                'Fb100arms_edge', 'Fb100_10Mb_edge']
subset_query = ['ECH_edge', 'Hama_edge', 'Olive_edge']
display((results
 .query('Annotation in @subset_annot and Query in @subset_query')
 .sort_values(['Annotation','Query'])
 .filter(['Annotation','Query', 'Jaccard P-value', 'Proximity P-value'])
)
)| Annotation | Query | Jaccard P-value | Proximity P-value | |
|---|---|---|---|---|
| 20 | Fb100_10Mb_edge | ECH_edge | 0.06767 | 0.34382 |
| 26 | Fb100_10Mb_edge | Hama_edge | 0.63328 | 0.40403 |
| 32 | Fb100_10Mb_edge | Olive_edge | 0.47526 | 0.42551 |
| 18 | Fb100arms_edge | ECH_edge | 0.00404 | 0.18026 |
| 24 | Fb100arms_edge | Hama_edge | 0.95055 | 0.64811 |
| 30 | Fb100arms_edge | Olive_edge | 0.87121 | 0.54679 |
| 21 | RS100_10Mb_edge | ECH_edge | 0.00498 | 0.35419 |
| 27 | RS100_10Mb_edge | Hama_edge | 0.21629 | 0.67565 |
| 33 | RS100_10Mb_edge | Olive_edge | 0.71941 | 0.64567 |
| 19 | RS100arms_edge | ECH_edge | 0.03379 | 0.38942 |
| 25 | RS100arms_edge | Hama_edge | 0.54103 | 0.60123 |
| 31 | RS100arms_edge | Olive_edge | 0.75761 | 0.43135 |
# plot the significant proximity-result
query=ech_dict['edges']
annot= fb100_dict['full']

plot_regions(query, annot, interval_intersect(query, annot), track_titles=['ECH90', 'Fb100_full', 'Intersect'])

# plot some Jaccard-results

query=ech_dict['edges']
annot= edge_df['round_spermatid_100kb_10Mb_edges']

plot_regions(query, annot, interval_intersect(query, annot), track_titles=['ECH90', 'RS100_10Mb_edges', 'Intersect'])

import matplotlib.pyplot as plt
import seaborn as sns

test_results = (
    results
    .query('Annotation in @subset_annot and Query in @subset_query')
    .filter(['Annotation','Query', 'Jaccard P-value', 'Proximity P-value'])
)

# Melt the results to a P-value column
test_results_melt = (
    test_results
    .rename(columns={'Jaccard P-value': 'Jaccard', 'Proximity P-value': 'Proximity'})
    .melt(
        id_vars=['Query', 'Annotation'],
        value_vars=['Jaccard', 'Proximity'],
        var_name='type', value_name='p-value')
    .assign(logp=lambda x: -np.log10(x['p-value']))
)

source_order = ['Fb', 'Spa', 'Pac', 'RS', 'Spz']

f,ax = plt.subplots(figsize=(3,2))

g = sns.barplot(
    data=test_results_melt, x='Annotation', y='logp', hue='type',
    order=source_order, ax = ax
    )
ax.axhline(-np.log10(0.05), color='tab:red', linestyle='--')


sns.despine(ax=g, left=True)

g.set_ylabel('-log10(p)')
g.set_xlabel('')
g.get_legend().set_title('')
sns.move_legend(g, 'upper center', bbox_to_anchor=(0.4,0.975))

Do new test with limits (2bp)
# Calcilate the proximity and Jaccard tests
# Annot: Fb, SPA, PAC, RS, SP (edges)
# Query: ECH

# Define the samples

annots = {
    'Fb': dataframes['fibroblast_100kb_arms'],
    'Spa': dataframes['spermatogonia_100kb_arms'],
    'Pac': dataframes['pachytene_spermatocyte_100kb_arms'],
    'RS': dataframes['round_spermatid_100kb_arms'],
    'Spz': dataframes['sperm_100kb_arms']
}
queries = {
    'ECH': ech90,
    'ECH_lim': make_edges(ech90, 1),
    'Hama_lim': make_edges(high_hama, 1),
    'Olive_lim': make_edges(high_olive, 1)
}

# Run the tests

test_results = {
    'Query': [],
    'Source': [],
    'Type': [],
    'Jaccard': [],
    'Proximity': []
}

for i,(name,annot) in enumerate(annots.items()):
    print(f'{i+1} of {len(annots)}: {name}')

    tmp_annots = {'comps': annot,
                  'edges': make_edges(annot, 100_000),
                  'limits': make_edges(annot, 1)}

    for tmp_query_key, query in queries.items():
        print(f'\tQuery: {tmp_query_key}')
        for tmp_key, tmp_annot in tmp_annots.items():
            print(f'\t\t{tmp_key}',end=' ')
            _, j_p = jaccard_test(query, tmp_annot)
            print('--> Jaccard done', end=' ')
            query_non_ovl = query.loc[~overlaps(query, tmp_annot)]
            _, p_p = proximity_test(query_non_ovl, tmp_annot)
            print('--> Proximity done.')

            # Append to results
            test_results['Query'].append(tmp_query_key)
            test_results['Source'].append(name)
            test_results['Type'].append(tmp_key)
            test_results['Jaccard'].append(j_p)
            test_results['Proximity'].append(p_p)

results = pd.DataFrame(test_results)
results
1 of 5: Fb
Query: ECH
comps --> Jaccard done --> Proximity done.
edges --> Jaccard done --> Proximity done.
limits --> Jaccard done --> Proximity done.
Query: ECH_lim
comps --> Jaccard done --> Proximity done.
edges --> Jaccard done --> Proximity done.
limits --> Jaccard done --> Proximity done.
Query: Hama_lim
comps --> Jaccard done --> Proximity done.
edges --> Jaccard done --> Proximity done.
limits --> Jaccard done --> Proximity done.
Query: Olive_lim
comps --> Jaccard done --> Proximity done.
edges --> Jaccard done --> Proximity done.
limits --> Jaccard done --> Proximity done.
2 of 5: Spa
Query: ECH
comps --> Jaccard done --> Proximity done.
edges --> Jaccard done --> Proximity done.
limits --> Jaccard done --> Proximity done.
Query: ECH_lim
comps --> Jaccard done --> Proximity done.
edges --> Jaccard done --> Proximity done.
limits --> Jaccard done --> Proximity done.
Query: Hama_lim
comps --> Jaccard done --> Proximity done.
edges --> Jaccard done --> Proximity done.
limits --> Jaccard done --> Proximity done.
Query: Olive_lim
comps --> Jaccard done --> Proximity done.
edges --> Jaccard done --> Proximity done.
limits --> Jaccard done --> Proximity done.
3 of 5: Pac
Query: ECH
comps --> Jaccard done --> Proximity done.
edges --> Jaccard done --> Proximity done.
limits --> Jaccard done --> Proximity done.
Query: ECH_lim
comps --> Jaccard done --> Proximity done.
edges --> Jaccard done --> Proximity done.
limits --> Jaccard done --> Proximity done.
Query: Hama_lim
comps --> Jaccard done --> Proximity done.
edges --> Jaccard done --> Proximity done.
limits --> Jaccard done --> Proximity done.
Query: Olive_lim
comps --> Jaccard done --> Proximity done.
edges --> Jaccard done --> Proximity done.
limits --> Jaccard done --> Proximity done.
4 of 5: RS
Query: ECH
comps --> Jaccard done --> Proximity done.
edges --> Jaccard done --> Proximity done.
limits --> Jaccard done --> Proximity done.
Query: ECH_lim
comps --> Jaccard done --> Proximity done.
edges --> Jaccard done --> Proximity done.
limits --> Jaccard done --> Proximity done.
Query: Hama_lim
comps --> Jaccard done --> Proximity done.
edges --> Jaccard done --> Proximity done.
limits --> Jaccard done --> Proximity done.
Query: Olive_lim
comps --> Jaccard done --> Proximity done.
edges --> Jaccard done --> Proximity done.
limits --> Jaccard done --> Proximity done.
5 of 5: Spz
Query: ECH
comps --> Jaccard done --> Proximity done.
edges --> Jaccard done --> Proximity done.
limits --> Jaccard done --> Proximity done.
Query: ECH_lim
comps --> Jaccard done --> Proximity done.
edges --> Jaccard done --> Proximity done.
limits --> Jaccard done --> Proximity done.
Query: Hama_lim
comps --> Jaccard done --> Proximity done.
edges --> Jaccard done --> Proximity done.
limits --> Jaccard done --> Proximity done.
Query: Olive_lim
comps --> Jaccard done --> Proximity done.
edges --> Jaccard done --> Proximity done.
limits --> Jaccard done --> Proximity done.| Query | Source | Type | Jaccard | Proximity | |
|---|---|---|---|---|---|
| 0 | ECH | Fb | comps | 0.19934 | 0.82548 |
| 1 | ECH | Fb | edges | 0.01199 | 0.31260 |
| 2 | ECH | Fb | limits | 0.00530 | 0.55282 |
| 3 | ECH_lim | Fb | comps | 0.40849 | 0.65961 |
| 4 | ECH_lim | Fb | edges | 0.03409 | 0.29474 |
| 5 | ECH_lim | Fb | limits | 1.00000 | 0.55628 |
| 6 | Hama_lim | Fb | comps | 0.12358 | 0.62059 |
| 7 | Hama_lim | Fb | edges | 0.87612 | 0.89615 |
| 8 | Hama_lim | Fb | limits | 1.00000 | 0.86046 |
| 9 | Olive_lim | Fb | comps | 0.27137 | 0.36505 |
| 10 | Olive_lim | Fb | edges | 0.85070 | 0.51847 |
| 11 | Olive_lim | Fb | limits | 1.00000 | 0.60821 |
| 12 | ECH | Spa | comps | 0.05156 | 0.00314 |
| 13 | ECH | Spa | edges | 0.49491 | 0.24411 |
| 14 | ECH | Spa | limits | 0.68780 | 0.23246 |
| 15 | ECH_lim | Spa | comps | 0.33333 | 0.03413 |
| 16 | ECH_lim | Spa | edges | 0.23260 | 0.09237 |
| 17 | ECH_lim | Spa | limits | 1.00000 | 0.04169 |
| 18 | Hama_lim | Spa | comps | 0.09449 | 0.51142 |
| 19 | Hama_lim | Spa | edges | 0.62895 | 0.61381 |
| 20 | Hama_lim | Spa | limits | 0.00001 | 0.50210 |
| 21 | Olive_lim | Spa | comps | 0.57259 | 0.58325 |
| 22 | Olive_lim | Spa | edges | 0.91817 | 0.19321 |
| 23 | Olive_lim | Spa | limits | 1.00000 | 0.46966 |
| 24 | ECH | Pac | comps | 0.59824 | 0.42413 |
| 25 | ECH | Pac | edges | 0.10229 | 0.74138 |
| 26 | ECH | Pac | limits | 0.15461 | 0.69764 |
| 27 | ECH_lim | Pac | comps | 0.46237 | 0.92811 |
| 28 | ECH_lim | Pac | edges | 0.10141 | 0.74043 |
| 29 | ECH_lim | Pac | limits | 1.00000 | 0.71976 |
| 30 | Hama_lim | Pac | comps | 0.39982 | 0.66599 |
| 31 | Hama_lim | Pac | edges | 0.48866 | 0.22423 |
| 32 | Hama_lim | Pac | limits | 0.00005 | 0.44405 |
| 33 | Olive_lim | Pac | comps | 0.03725 | 0.78024 |
| 34 | Olive_lim | Pac | edges | 0.58759 | 0.34903 |
| 35 | Olive_lim | Pac | limits | 0.00004 | 0.39258 |
| 36 | ECH | RS | comps | 0.10578 | 0.07079 |
| 37 | ECH | RS | edges | 0.01046 | 0.61816 |
| 38 | ECH | RS | limits | 0.00655 | 0.73480 |
| 39 | ECH_lim | RS | comps | 0.18603 | 0.34104 |
| 40 | ECH_lim | RS | edges | 0.11797 | 0.53686 |
| 41 | ECH_lim | RS | limits | 1.00000 | 0.35290 |
| 42 | Hama_lim | RS | comps | 0.01714 | 0.85609 |
| 43 | Hama_lim | RS | edges | 0.56556 | 0.78961 |
| 44 | Hama_lim | RS | limits | 1.00000 | 0.78258 |
| 45 | Olive_lim | RS | comps | 0.39299 | 0.78907 |
| 46 | Olive_lim | RS | edges | 0.66654 | 0.75863 |
| 47 | Olive_lim | RS | limits | 1.00000 | 0.56521 |
| 48 | ECH | Spz | comps | 0.03892 | 0.86643 |
| 49 | ECH | Spz | edges | 0.07330 | 0.63545 |
| 50 | ECH | Spz | limits | 0.08195 | 0.88817 |
| 51 | ECH_lim | Spz | comps | 0.10352 | 0.54812 |
| 52 | ECH_lim | Spz | edges | 0.80407 | 0.54553 |
| 53 | ECH_lim | Spz | limits | 1.00000 | 0.73543 |
| 54 | Hama_lim | Spz | comps | 0.20128 | 0.13174 |
| 55 | Hama_lim | Spz | edges | 0.53662 | 0.22328 |
| 56 | Hama_lim | Spz | limits | 1.00000 | 0.09604 |
| 57 | Olive_lim | Spz | comps | 0.18841 | 0.59118 |
| 58 | Olive_lim | Spz | edges | 0.84400 | 0.55331 |
| 59 | Olive_lim | Spz | limits | 1.00000 | 0.64852 |
q_filter = ['ECH', 'Hama_lim', 'Olive_lim']

results.query('Query in @q_filter and Type == "limits"').sort_values(['Source', 'Type'])| Query | Source | Type | Jaccard | Proximity | |
|---|---|---|---|---|---|
| 2 | ECH | Fb | limits | 0.00530 | 0.55282 |
| 8 | Hama_lim | Fb | limits | 1.00000 | 0.86046 |
| 11 | Olive_lim | Fb | limits | 1.00000 | 0.60821 |
| 26 | ECH | Pac | limits | 0.15461 | 0.69764 |
| 32 | Hama_lim | Pac | limits | 0.00005 | 0.44405 |
| 35 | Olive_lim | Pac | limits | 0.00004 | 0.39258 |
| 38 | ECH | RS | limits | 0.00655 | 0.73480 |
| 44 | Hama_lim | RS | limits | 1.00000 | 0.78258 |
| 47 | Olive_lim | RS | limits | 1.00000 | 0.56521 |
| 14 | ECH | Spa | limits | 0.68780 | 0.23246 |
| 20 | Hama_lim | Spa | limits | 0.00001 | 0.50210 |
| 23 | Olive_lim | Spa | limits | 1.00000 | 0.46966 |
| 50 | ECH | Spz | limits | 0.08195 | 0.88817 |
| 56 | Hama_lim | Spz | limits | 1.00000 | 0.09604 |
| 59 | Olive_lim | Spz | limits | 1.00000 | 0.64852 |
import matplotlib.pyplot as plt
import seaborn as sns

# Melt the results to a P-value column
test_results_melt = (
    results.query('Query == "ECH_limits"')
    .melt(
        id_vars=['Query', 'Source'],
        value_vars=['Jaccard', 'Proximity'],
        var_name='test', value_name='p-value')
    .assign(logp=lambda x: -np.log10(x['p-value']))
)

source_order = ['Fb', 'Spa', 'Pac', 'RS', 'Spz']

f,ax = plt.subplots(figsize=(3,2))

g = sns.barplot(
    data=test_results_melt, x='Source', y='logp', hue='test',
    order=source_order, ax = ax
    )
ax.axhline(-np.log10(0.05), color='tab:red', linestyle='--')


sns.despine(ax=g, left=True)

g.set_ylabel('-log10(p)')
g.set_xlabel('')
g.get_legend().set_title('')
sns.move_legend(g, 'upper center', bbox_to_anchor=(0.4,0.975))
--------------------------------------------------------------------------- AttributeError Traceback (most recent call last) Cell In[38], line 29 27 g.set_ylabel('-log10(p)') 28 g.set_xlabel('') ---> 29 g.get_legend().set_title('') 30 sns.move_legend(g, 'upper center', bbox_to_anchor=(0.4,0.975)) AttributeError: 'NoneType' object has no attribute 'set_title'

Old test
# # Now we should test

# from genominterv import proximity_test, interval_diff, jaccard_stat, bootstrap

# #query = ech90
# query = edges['round_spermatid_100kb_arms']
# annot_hama = hama_edges
# #annot_olive = baboon_dict['P.anubis']
# b = 1_000

# # Proximity test
# non_ovl_query_hama = interval_diff(query, annot_hama)
# #non_ovl_query_olive = interval_diff(query, annot_olive)

# proximity_hama = proximity_test(non_ovl_query_hama, annot_hama, two_sided=True, samples=10_000)
# #proximity_olive = proximity_test(non_ovl_query_olive, annot_olive, two_sided=True, samples=10_000)

# # Jaccard index

# @bootstrap(chromsizes, samples=b, smaller=False)
# def jaccard_bootstrap(query, annot):
#     return jaccard_stat(query, annot)

# jaccard_hama = jaccard_bootstrap(query, annot_hama)
# #jaccard_olive = jaccard_bootstrap(query, annot_olive)

# print(f"""
# Proximity test results:
#     Hama: {proximity_hama}
#  #   Olive: {proximity_olive}

# Jaccard index results:
#     Hama: {jaccard_hama}
#   #  Olive: {jaccard_olive}
# """)

# # # Swap annot and query

# # non_ovl_query_hama = interval_diff(annot_hama, query)
# # non_ovl_query_olive = interval_diff(annot_olive, query)

# # proximity_hama_flip = proximity_test(non_ovl_query_hama, query, two_sided=True, samples=b)
# # proximity_olive_flip = proximity_test(non_ovl_query_olive, query, two_sided=True, samples=b)

# # jaccard_hama_flip = jaccard_bootstrap(annot_hama, query)
# # jaccard_olive_flip = jaccard_bootstrap(annot_olive, query)
# Make a long dataframe

# pd.DataFrame({
#     'Group': ['P.hama', 'P.anubis'],
#     #'Proximity Statistic': [proximity_hama.statistic, proximity_olive.statistic],
#     'Proximity P-value': [proximity_hama.pvalue, proximity_olive.pvalue],
#     #'Jaccard Index': [jaccard_hama[0], jaccard_olive[0]],
#     'Jaccard P-value': [jaccard_hama[1], jaccard_olive[1]]
# }).melt(id_vars='Group', var_name='Test', value_name='Value')

pd.DataFrame({
    'Group': ['P.hama', 'P.anubis'],
    #'Proximity Statistic': [proximity_hama.statistic, proximity_olive.statistic],
    'Proximity P-value': [proximity_hama.pvalue, proximity_olive.pvalue],
    #'Jaccard Index': [jaccard_hama[0], jaccard_olive[0]],
    'Jaccard P-value': [jaccard_hama[1], jaccard_olive[1]],
    # #'Proximity Statistic (flip)': [proximity_hama_flip.statistic, proximity_olive_flip.statistic],
    # 'Proximity P-value (flip)': [proximity_hama_flip.pvalue, proximity_olive_flip.pvalue],
    # #'Jaccard Index (flip)': [jaccard_hama_flip[0], jaccard_olive_flip[0]],
    # 'Jaccard P-value (flip)': [jaccard_hama_flip[1], jaccard_olive_flip[1]],
}).melt(id_vars='Group', var_name='Test', value_name='Value')
| Group | Test | Value | |
|---|---|---|---|
| 0 | P.hama | Proximity P-value | 0.0069 |
| 1 | P.anubis | Proximity P-value | 0.0274 |
| 2 | P.hama | Jaccard P-value | 0.2720 |
| 3 | P.anubis | Jaccard P-value | 0.8250 |
Plot the relative distances (proximities)
ech90.assign(start=ech90['start']-5000,
end = ech90['end']+5000)| chrom | start | end | length | |
|---|---|---|---|---|
| 0 | chrX | 19531773 | 19641984 | 100211 |
| 1 | chrX | 20930188 | 21051124 | 110936 |
| 2 | chrX | 36218142 | 36427842 | 199700 |
| 3 | chrX | 37230935 | 37637028 | 396093 |
| 4 | chrX | 49511522 | 50019126 | 497604 |
| 5 | chrX | 50816385 | 51449493 | 623108 |
| 6 | chrX | 53897995 | 54111817 | 203822 |
| 7 | chrX | 62091538 | 62298349 | 196811 |
| 8 | chrX | 70884995 | 71154673 | 259678 |
| 9 | chrX | 71783766 | 72149275 | 355509 |
| 10 | chrX | 74336598 | 74640686 | 294088 |
| 11 | chrX | 96245950 | 96344522 | 88572 |
| 12 | chrX | 108173096 | 108564466 | 381370 |
| 13 | chrX | 111297881 | 111601540 | 293659 |
| 14 | chrX | 124073238 | 124182167 | 98929 |
| 15 | chrX | 126833587 | 127249031 | 405444 |
| 16 | chrX | 128398780 | 128706766 | 297986 |
| 17 | chrX | 129729920 | 130039306 | 299386 |
| 18 | chrX | 150800639 | 151219408 | 408769 |
# Size of each of the dataframes

print(f"""
rs100_full: {rs100_dict['full'].shape[0]}
rs100_edges: {rs100_dict['edges'].shape[0]}
fb100_full: {fb100_dict['full'].shape[0]}
fb100_edges: {fb100_dict['edges'].shape[0]}
hama_dict: {hama_dict['full'].shape[0]}
ech_dict: {ech_dict['full'].shape[0]}

""")
rs100_full: 77
rs100_edges: 96
fb100_full: 59
fb100_edges: 83
hama_dict: 31
ech_dict: 19
import seaborn as sns
from genominterv.remapping import remap_interval_data

n = 1000
a = np.sort(np.random.randint(1, 10_000_000, size=n))
annot = pd.DataFrame(dict(chrom='chrX', start=a, end=a+10))
q = np.sort(np.random.randint(1, 10_000_000, size=n))
query = pd.DataFrame(dict(chrom='chrX', start=q, end=q+10))
df1 = remap_interval_data(query, annot, relative=True)
df1['mid'] = (df1.start + df1.end) / 2
df1['absmid'] = df1.mid.abs()

# dummy data
a = np.sort(np.random.randint(1, 10_000_000, size=n))
annot = pd.DataFrame(dict(chrom='chrX', start=a, end=a+10))
q = a + np.random.randint(-1000, 1000, size=n)
query = pd.DataFrame(dict(chrom='chrX', start=q, end=q+10))
df2 = remap_interval_data(query, annot, relative=True)
df2['mid'] = (df2.start + df2.end) / 2
df2['absmid'] = df2.mid.abs()

# Real data
q1 = hama_dict['full']
a1 = rs100_dict['full']
df3 = remap_interval_data(q1, a1, relative=True)
df3['mid'] = (df3.start + df3.end) / 2
df3['absmid'] = df3.mid.abs()

q2 = hama_dict['full']
a2 = fb100_dict['full']
df4 = remap_interval_data(q2, a2, relative=True)
df4['mid'] = (df4.start + df4.end) / 2
df4['absmid'] = df4.mid.abs()

sns.histplot(df3, x='mid', bins=np.linspace(-0.5, 0.5, 20))
sns.histplot(df4, x='mid', bins=np.linspace(-0.5, 0.5, 20))
sns.histplot(df3, x='absmid', bins=np.linspace(0, 0.5, 20))
sns.histplot(df4, x='absmid', bins=np.linspace(0, 0.5, 20))
df3['dist'] = 'uniform'
df4['dist'] = 'closer'
df = pd.concat([df3, df4])
sns.barplot(df, y='absmid', x='dist', hue='dist')
Geneinfo
How does the edges align with genes?
This first plot is just to figure out how to plot with gene_plot.
import geneinfo as gi
from matplotlib.patches import Rectangle
from matplotlib.collections import PatchCollection


# Use the proximity test results to plot the ECH90 regions and the compartment edges

start = full_intersect['start'][2]
end = full_intersect['end'][5]

rectangles = [Rectangle((start, 0.1), width=end-start, height=0.9, color='tab:green', linewidth=0, alpha=0.6) for start, end in zip(full_intersect['start'][2:6], full_intersect['end'][2:6])]

pc = PatchCollection(rectangles, match_original=True)

ax = gi.gene_plot('chrX', start-100_000, end+100_000, assembly='rheMac10')
ax.add_collection(pc)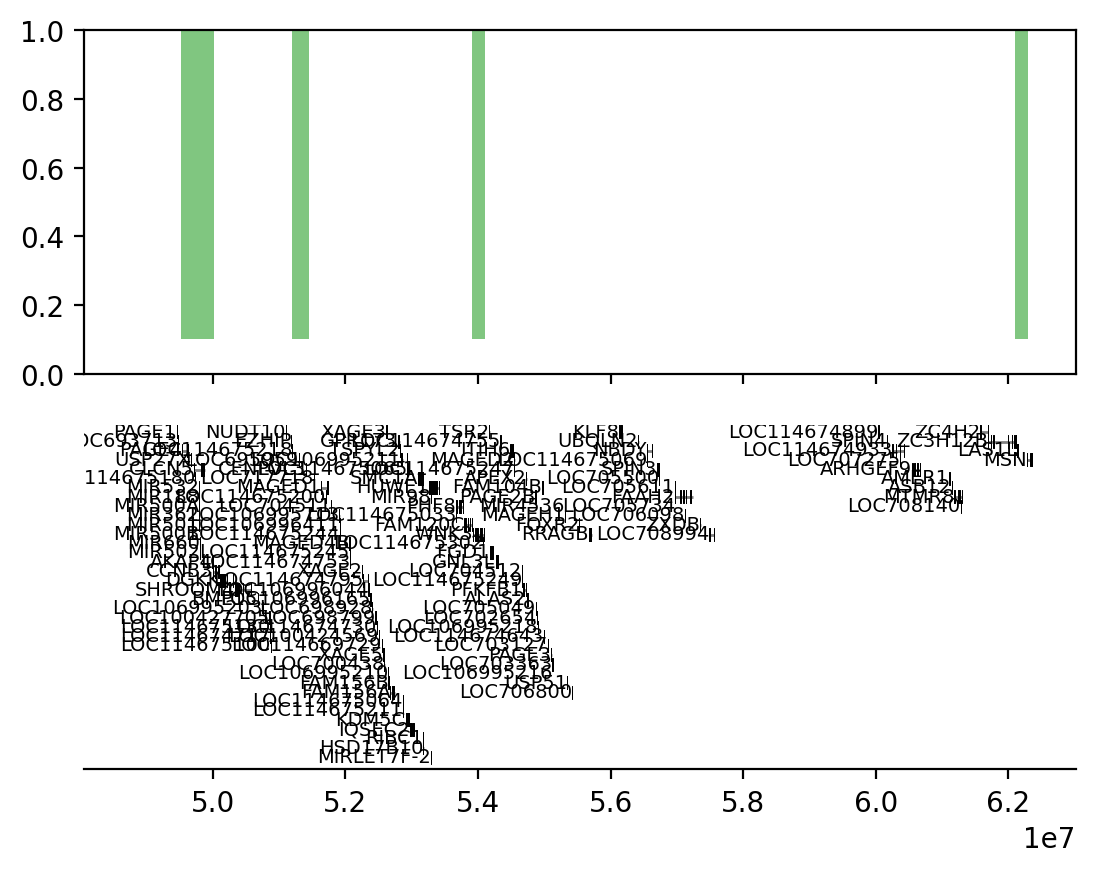
Get the geneinfo for all intersections between edges and ECH90
And write to a csv file. If the file exists, read it with pandas.
# Use get_genes_region
import os.path as op
import geneinfo as gi
import pandas as pd
from os import makedirs as mkdir

genes_dir = '../results/rec_edge_genes/'
if not op.exists(genes_dir):
    mkdir(genes_dir)

genes_file = op.join(genes_dir,'rs_edges_100kb_genes.csv')

if not op.exists(genes_file):
    genes = pd.concat(
        full_intersect.apply(
            lambda x: gi.get_genes_region_dataframe('chrX', x['start'], x['end'], assembly='rheMac10'),
            axis =1
            ).to_list(),
        ignore_index=True
    )
    genes.to_csv(genes_file, index=False)
else:
    genes = pd.read_csv(genes_file)
genes_list = genes['name'].unique().tolist()
genes_list['SH3KBP1',
'MIR7206',
'LANCL3',
'XK',
'CYBB',
'LOC696657',
'DYNLT3',
'PAGE4',
'USP27X',
'CLCN5',
'LOC114675180',
'MIR532',
'MIR188',
'MIR500A',
'MIR362',
'MIR501',
'MIR500B',
'MIR660',
'MIR502',
'AKAP4',
'CCNB3',
'LOC114675218',
'LOC695959',
'CENPVL3',
'FAM120C',
'WNK3',
'LOC114675302',
'ZC3H12B',
'LAS1L',
'MSN',
'ATRX',
'MAGT1',
'LOC114675151',
'COX7B',
'ATP7A',
'ALG13',
'LOC706958',
'TRPC5',
'ENOX2',
'RAP2C',
'LOC114675176',
'DKC1',
'LOC114675231',
'MPP1',
'SMIM9',
'F8',
'H2AFB3',
'FUNDC2',
'CMC4',
'MTCP1',
'BRCC3',
'LOC703257']import geneinfo as gi
from matplotlib.patches import Rectangle
from matplotlib.collections import PatchCollection
# Use the proximity test results to plot the ECH90 regions and the compartment edges
for i in full_intersect.index:
start_idx = i
end_idx = i
start = full_intersect['start'][start_idx]
end = full_intersect['end'][end_idx]
rectangles = [Rectangle(
(start, 0.1), width=end-start, height=0.9, color='tab:green', linewidth=0, alpha=0.6) for start, end in zip(full_intersect['start'][start_idx:end_idx+1], full_intersect['end'][start_idx:end_idx+1])]
pc = PatchCollection(rectangles, match_original=True)
ax = gi.gene_plot('chrX', start-100_000, end+100_000, assembly='rheMac10',
highlight=genes_list,
despine=True,
figsize=(5, 5),
aspect=5,
)
ax.add_collection(pc)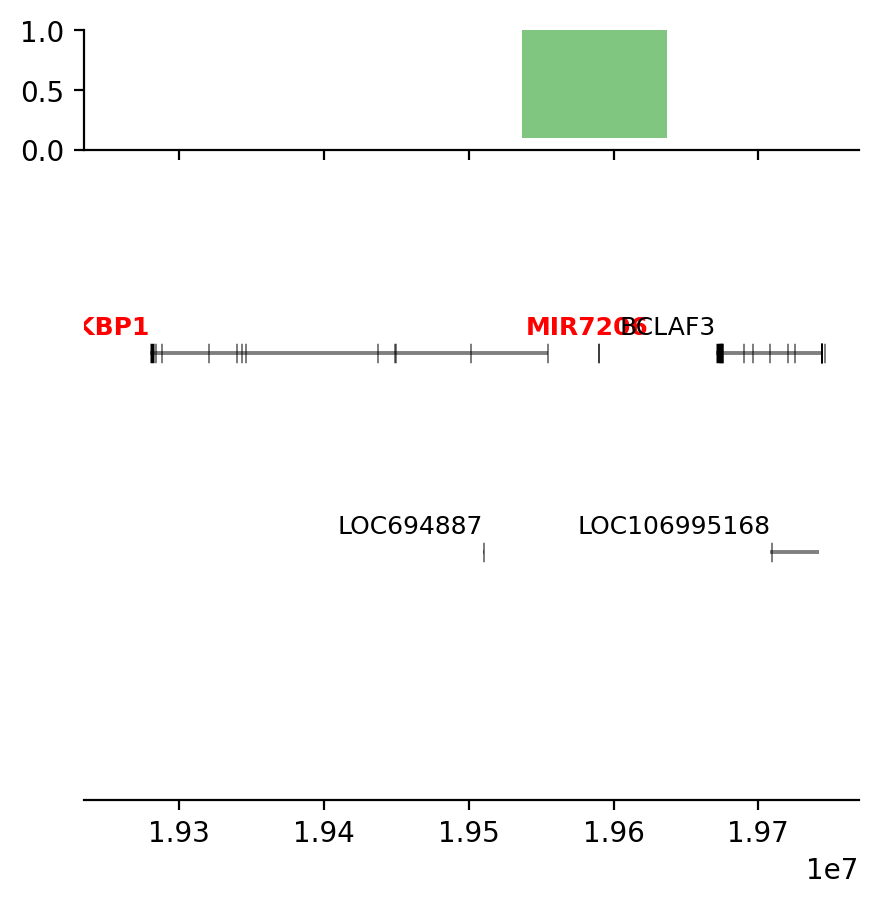
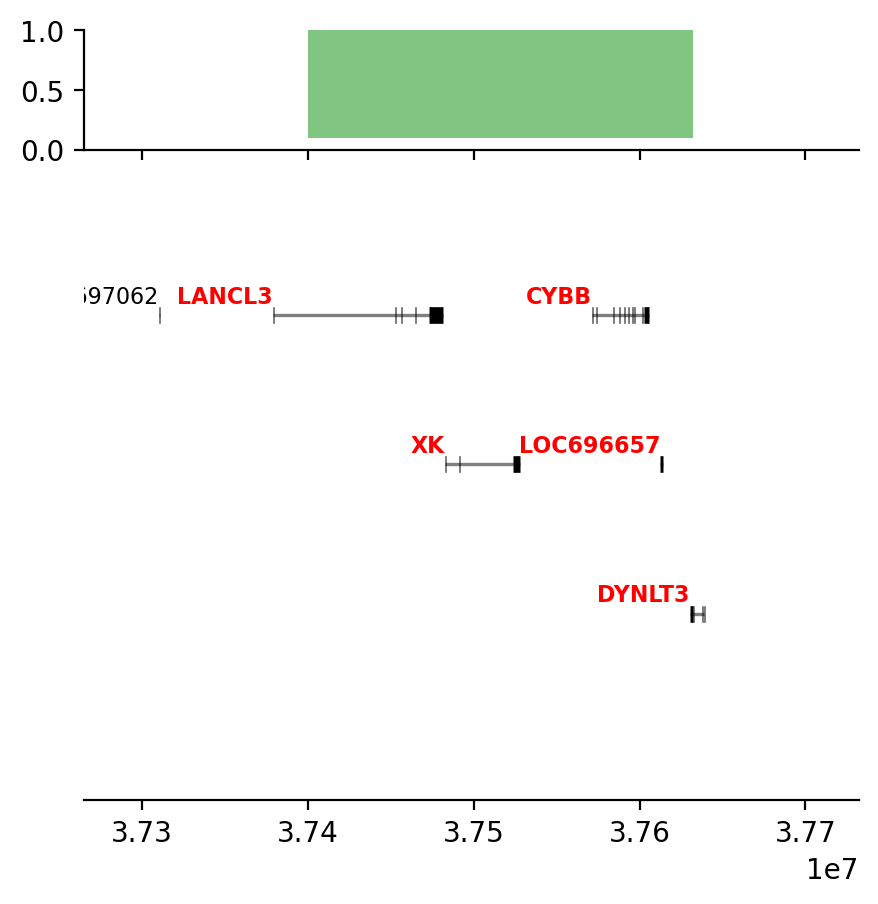
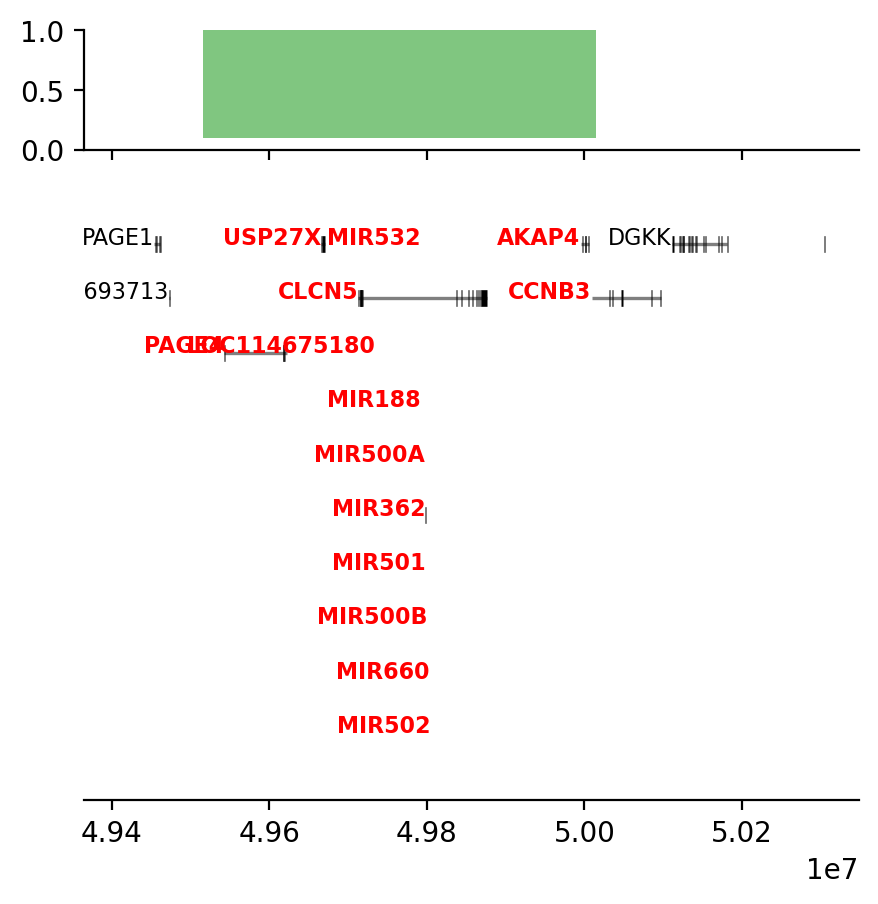
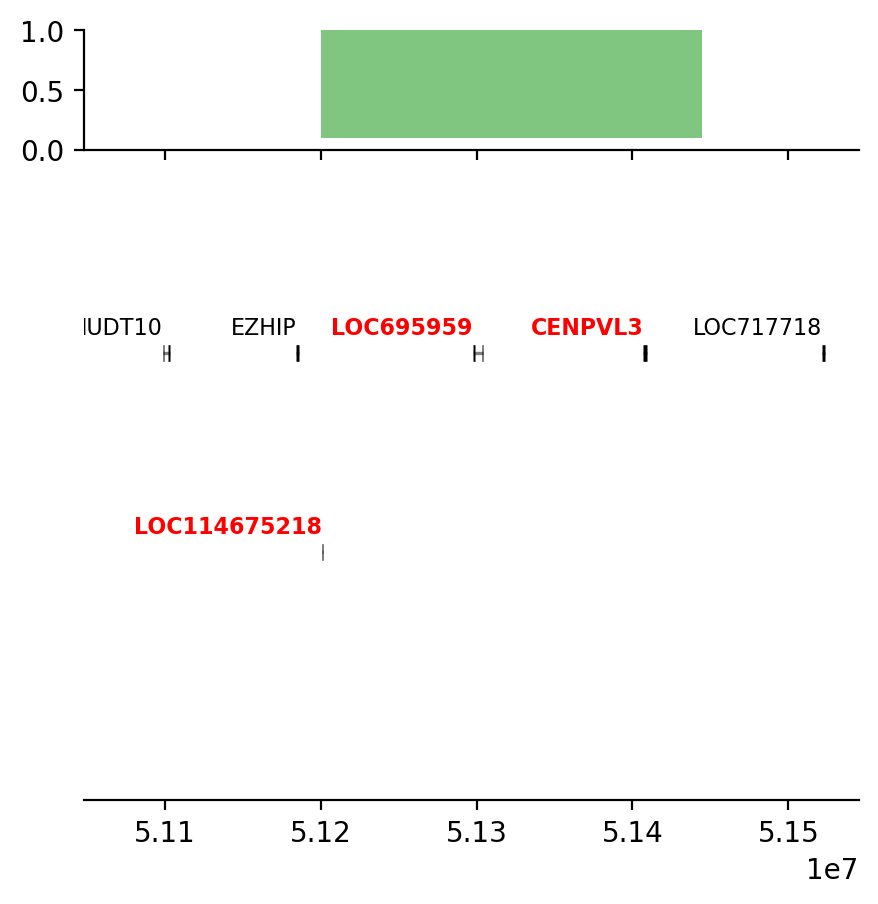
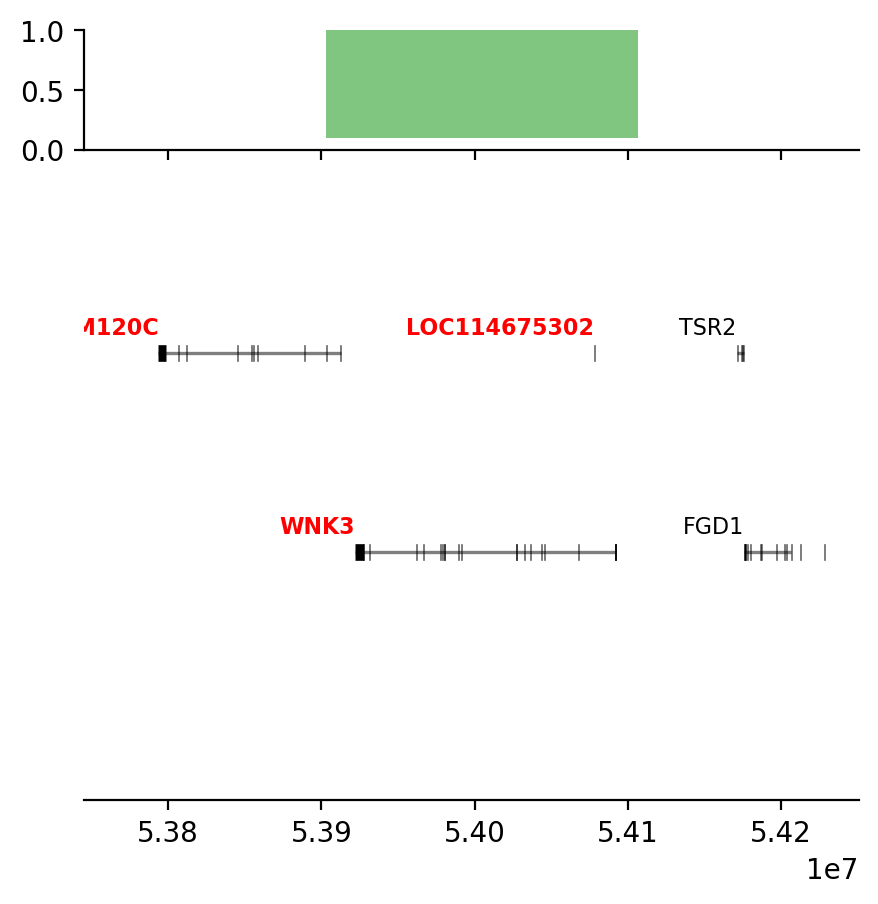
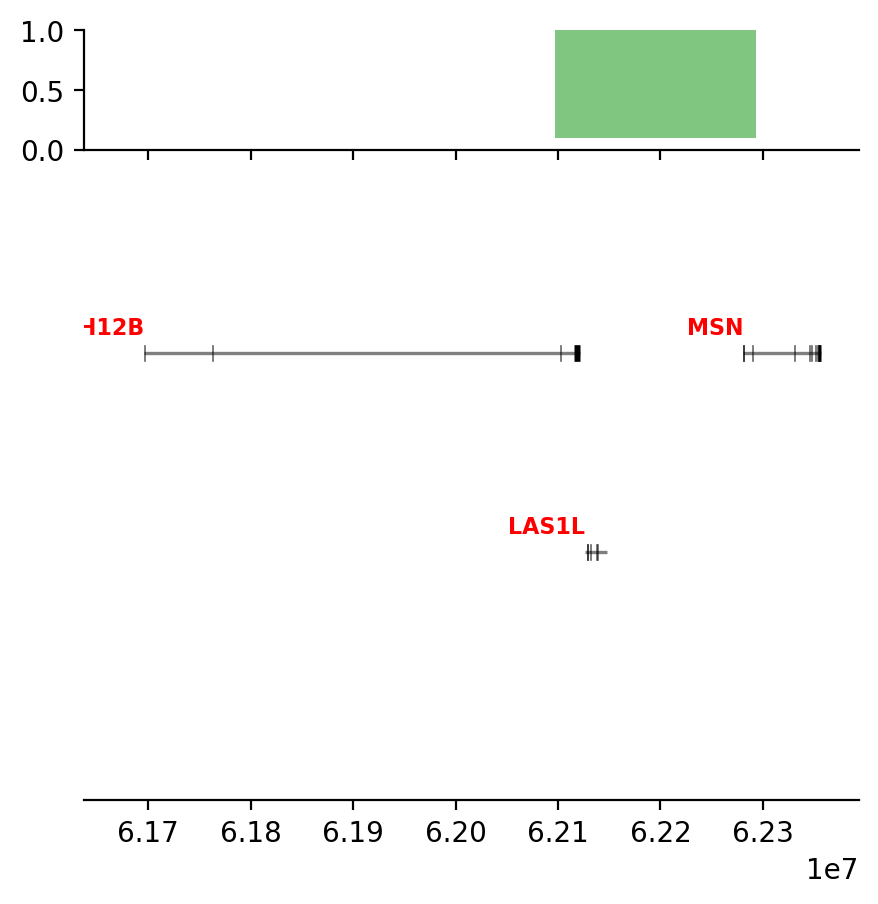
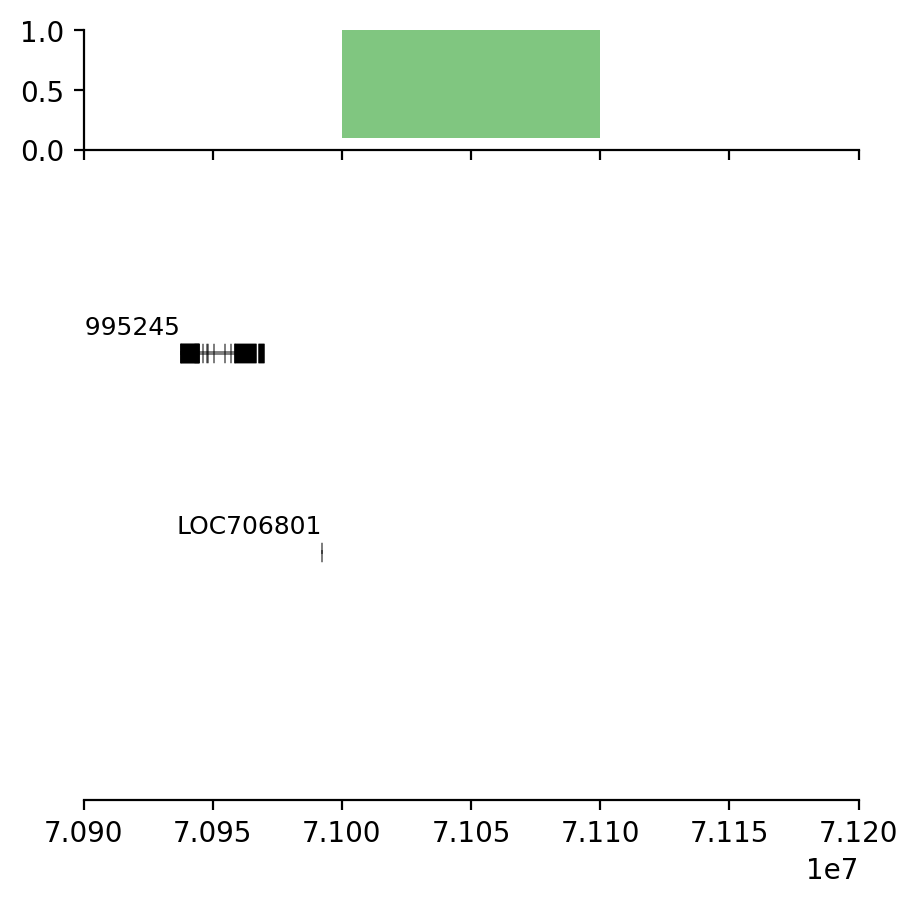
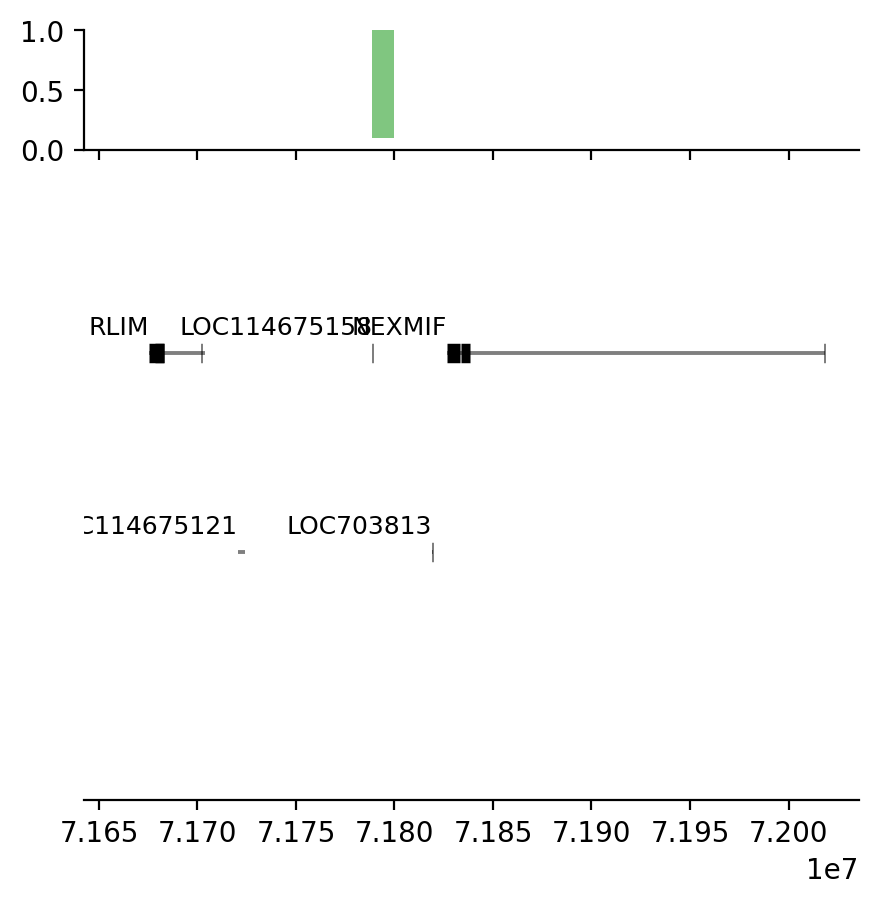
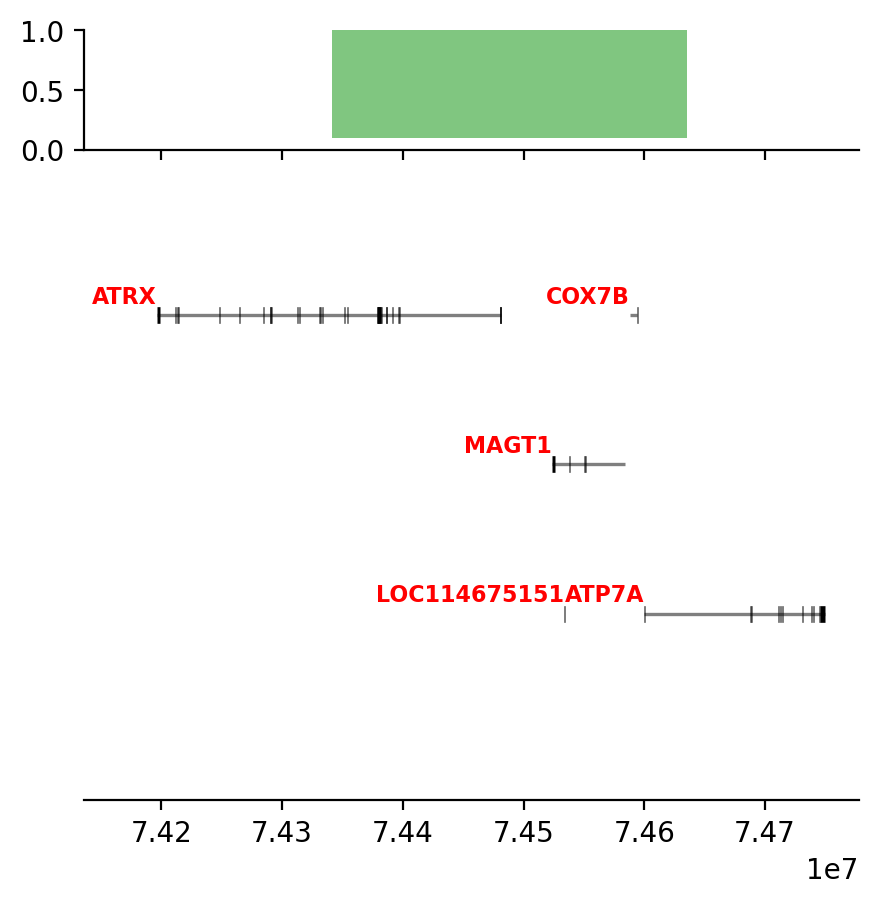
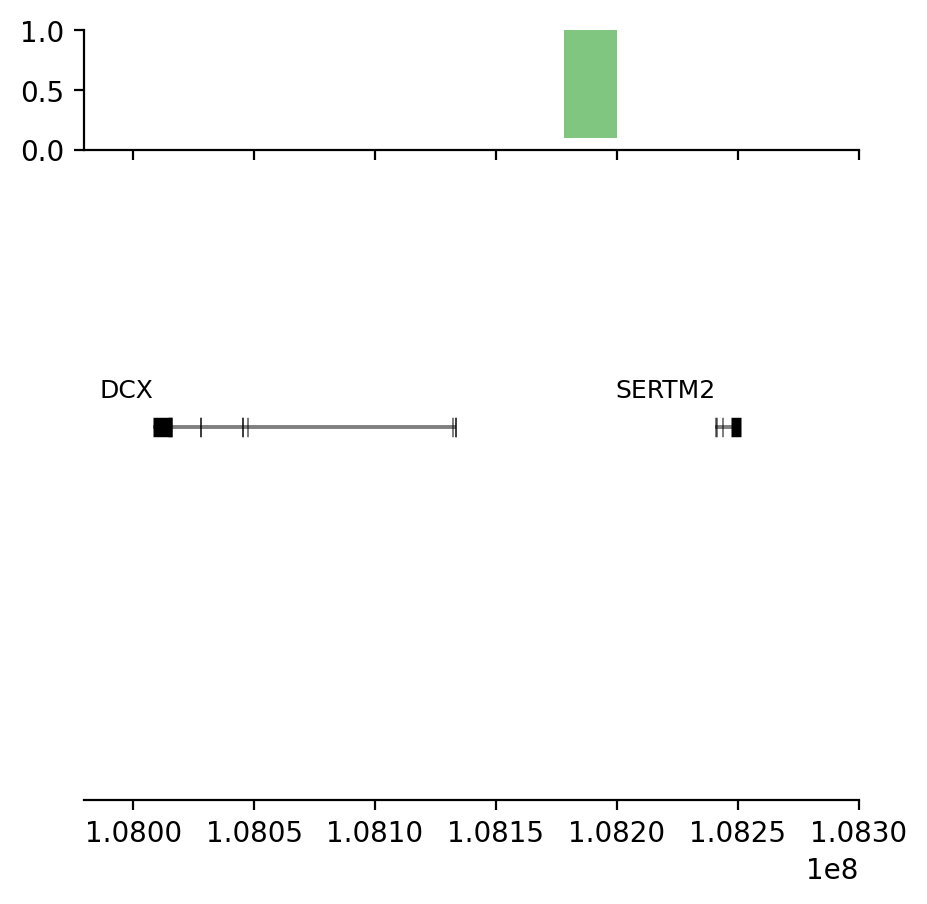
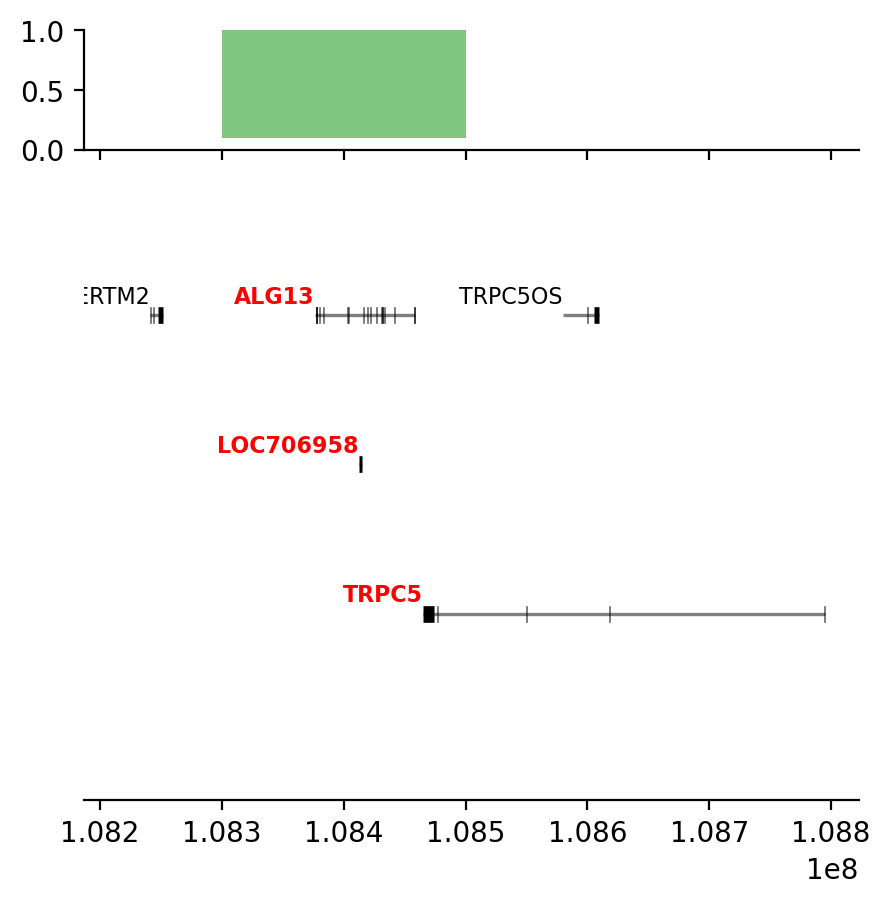
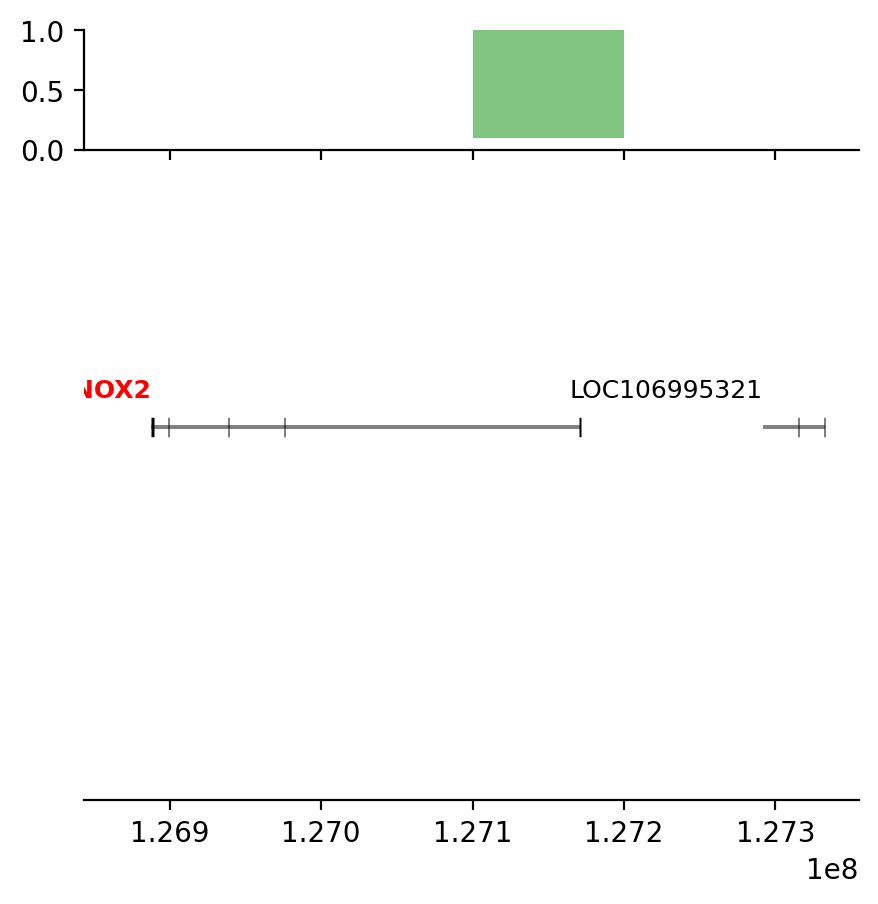
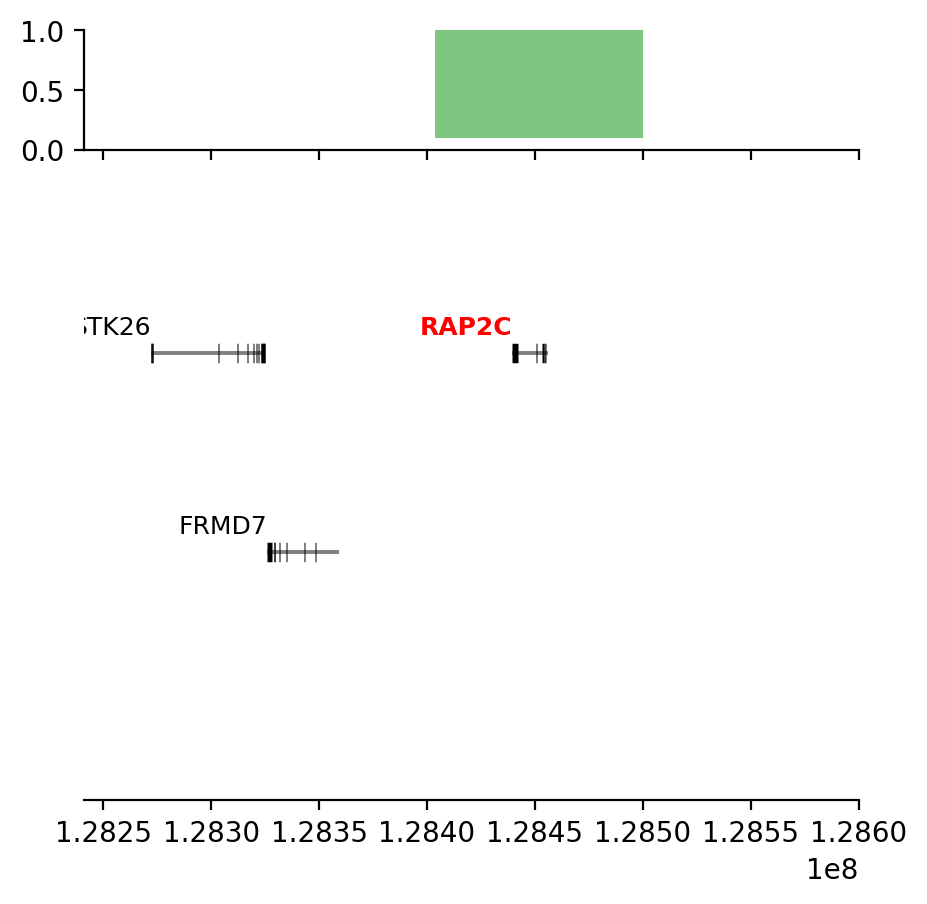
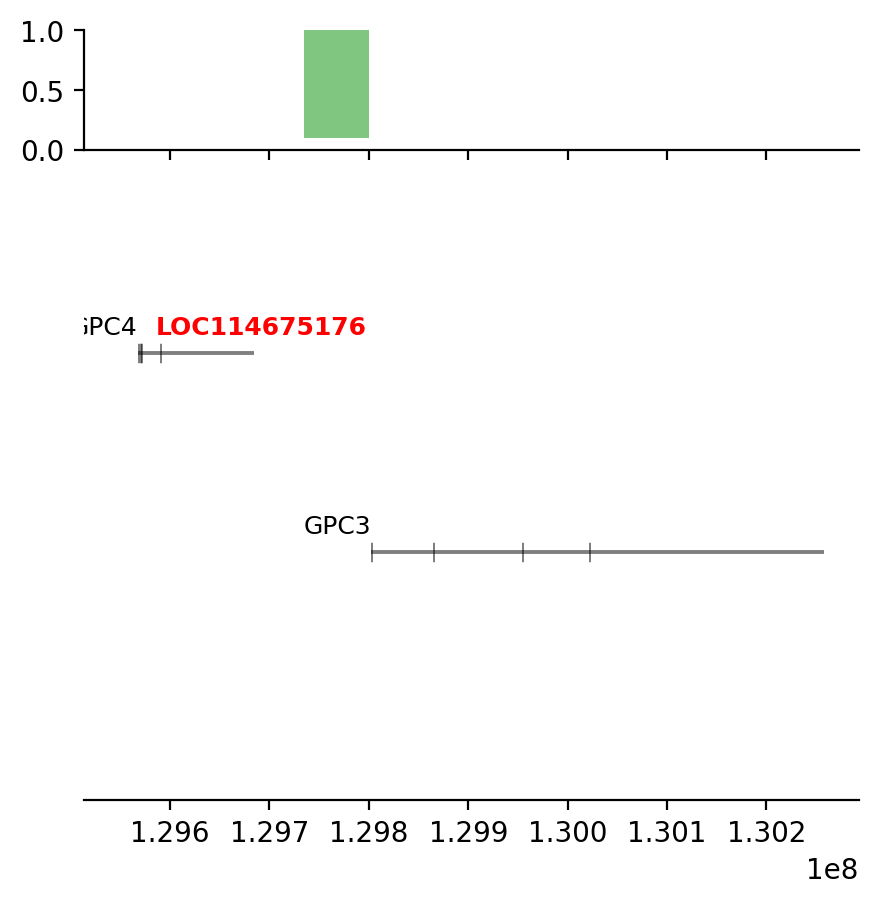
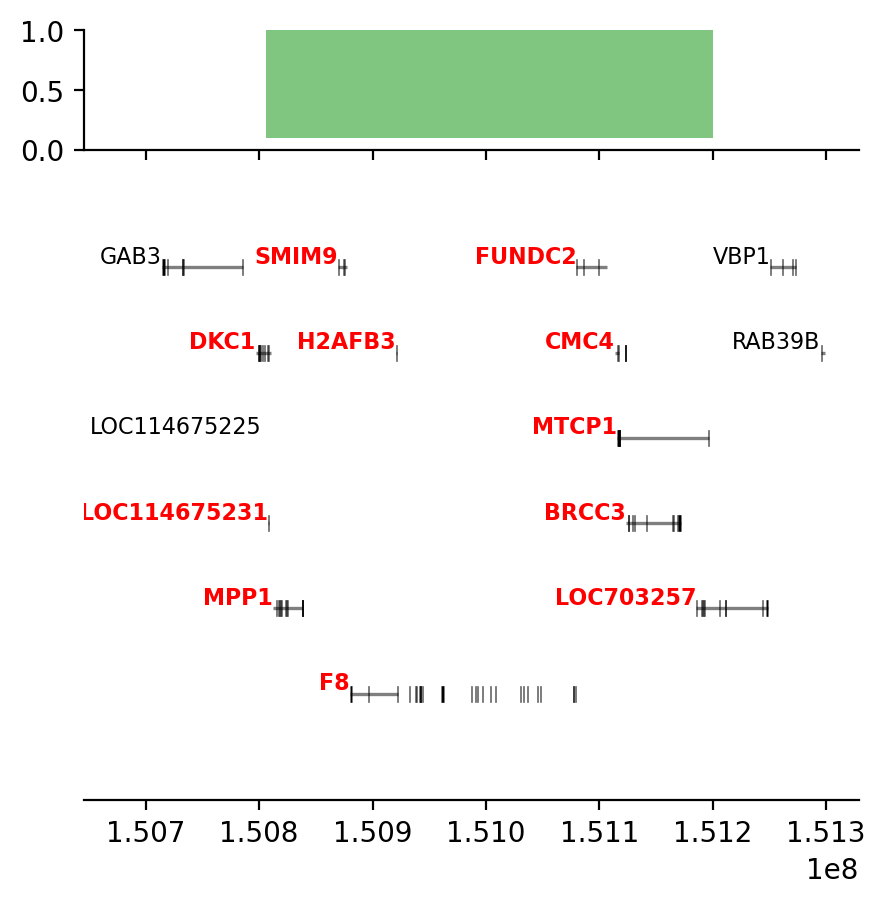
What can I do with the list of genes on the edges?
GO enrichment?
mmul_x_genes = gi.get_genes_region_dataframe('chrX', 0, 155_000_000, assembly='rheMac10')mmul_x_genelist = mmul_x_genes['name'].unique().tolist()gene_list = genes['name'].unique().tolist()
taxid = 9544
gi.email('sojernj@gmail.com')
#gi.go_annotation_table(taxid=taxid)
#gi.show_go_evidence_codes()
go_terms = gi.get_go_terms_for_genes(gene_list, taxid=taxid)len(go_terms)
#gene_list[:5]127results = gi.go_enrichment(
# Use human taxid as a start
gene_list,
alpha=0.05,
terms=go_terms)geneinfo_cache/go-basic.obo: fmt(1.2) rel(2024-10-27) 44,017 Terms; optional_attrs(def relationship)Could not map gene symbol "MIR7206" to ncbi id
Could not map gene symbol "LOC696657" to ncbi id
Could not map gene symbol "LOC114675180" to ncbi id--------------------------------------------------------------------------- KeyError Traceback (most recent call last) File ~/miniconda3/envs/hic/lib/python3.12/site-packages/geneinfo/__init__.py:1050, in _cached_symbol2ncbi(symbols, taxid) 1049 try: -> 1050 return symbol2ncbi.loc[symbols].tolist() 1051 except KeyError: File ~/miniconda3/envs/hic/lib/python3.12/site-packages/pandas/core/indexing.py:1191, in _LocationIndexer.__getitem__(self, key) 1190 maybe_callable = self._check_deprecated_callable_usage(key, maybe_callable) -> 1191 return self._getitem_axis(maybe_callable, axis=axis) File ~/miniconda3/envs/hic/lib/python3.12/site-packages/pandas/core/indexing.py:1420, in _LocIndexer._getitem_axis(self, key, axis) 1418 raise ValueError("Cannot index with multidimensional key") -> 1420 return self._getitem_iterable(key, axis=axis) 1422 # nested tuple slicing File ~/miniconda3/envs/hic/lib/python3.12/site-packages/pandas/core/indexing.py:1360, in _LocIndexer._getitem_iterable(self, key, axis) 1359 # A collection of keys -> 1360 keyarr, indexer = self._get_listlike_indexer(key, axis) 1361 return self.obj._reindex_with_indexers( 1362 {axis: [keyarr, indexer]}, copy=True, allow_dups=True 1363 ) File ~/miniconda3/envs/hic/lib/python3.12/site-packages/pandas/core/indexing.py:1558, in _LocIndexer._get_listlike_indexer(self, key, axis) 1556 axis_name = self.obj._get_axis_name(axis) -> 1558 keyarr, indexer = ax._get_indexer_strict(key, axis_name) 1560 return keyarr, indexer File ~/miniconda3/envs/hic/lib/python3.12/site-packages/pandas/core/indexes/base.py:6200, in Index._get_indexer_strict(self, key, axis_name) 6198 keyarr, indexer, new_indexer = self._reindex_non_unique(keyarr) -> 6200 self._raise_if_missing(keyarr, indexer, axis_name) 6202 keyarr = self.take(indexer) File ~/miniconda3/envs/hic/lib/python3.12/site-packages/pandas/core/indexes/base.py:6252, in Index._raise_if_missing(self, key, indexer, axis_name) 6251 not_found = list(ensure_index(key)[missing_mask.nonzero()[0]].unique()) -> 6252 raise KeyError(f"{not_found} not in index") KeyError: "['MIR7206', 'LOC696657', 'LOC114675180', 'MIR532', 'MIR188', 'MIR500A', 'MIR362', 'MIR501', 'MIR500B', 'MIR660', 'MIR502', 'LOC114675218', 'LOC695959', 'LOC114675302', 'LOC114675151', 'LOC706958', 'LOC114675176', 'LOC114675231', 'H2AFB3', 'LOC703257'] not in index" During handling of the above exception, another exception occurred: KeyError Traceback (most recent call last) File ~/miniconda3/envs/hic/lib/python3.12/site-packages/pandas/core/indexes/base.py:3805, in Index.get_loc(self, key) 3804 try: -> 3805 return self._engine.get_loc(casted_key) 3806 except KeyError as err: File index.pyx:167, in pandas._libs.index.IndexEngine.get_loc() File index.pyx:196, in pandas._libs.index.IndexEngine.get_loc() File pandas/_libs/hashtable_class_helper.pxi:7081, in pandas._libs.hashtable.PyObjectHashTable.get_item() File pandas/_libs/hashtable_class_helper.pxi:7089, in pandas._libs.hashtable.PyObjectHashTable.get_item() KeyError: 'MIR532' The above exception was the direct cause of the following exception: KeyError Traceback (most recent call last) File ~/miniconda3/envs/hic/lib/python3.12/site-packages/geneinfo/__init__.py:1055, in _cached_symbol2ncbi(symbols, taxid) 1054 try: -> 1055 geneids.append(symbol2ncbi.loc[symbol]) 1056 except KeyError: File ~/miniconda3/envs/hic/lib/python3.12/site-packages/pandas/core/indexing.py:1191, in _LocationIndexer.__getitem__(self, key) 1190 maybe_callable = self._check_deprecated_callable_usage(key, maybe_callable) -> 1191 return self._getitem_axis(maybe_callable, axis=axis) File ~/miniconda3/envs/hic/lib/python3.12/site-packages/pandas/core/indexing.py:1431, in _LocIndexer._getitem_axis(self, key, axis) 1430 self._validate_key(key, axis) -> 1431 return self._get_label(key, axis=axis) File ~/miniconda3/envs/hic/lib/python3.12/site-packages/pandas/core/indexing.py:1381, in _LocIndexer._get_label(self, label, axis) 1379 def _get_label(self, label, axis: AxisInt): 1380 # GH#5567 this will fail if the label is not present in the axis. -> 1381 return self.obj.xs(label, axis=axis) File ~/miniconda3/envs/hic/lib/python3.12/site-packages/pandas/core/generic.py:4301, in NDFrame.xs(self, key, axis, level, drop_level) 4300 else: -> 4301 loc = index.get_loc(key) 4303 if isinstance(loc, np.ndarray): File ~/miniconda3/envs/hic/lib/python3.12/site-packages/pandas/core/indexes/base.py:3812, in Index.get_loc(self, key) 3811 raise InvalidIndexError(key) -> 3812 raise KeyError(key) from err 3813 except TypeError: 3814 # If we have a listlike key, _check_indexing_error will raise 3815 # InvalidIndexError. Otherwise we fall through and re-raise 3816 # the TypeError. KeyError: 'MIR532' During handling of the above exception, another exception occurred: HTTPError Traceback (most recent call last) Cell In[55], line 1 ----> 1 results = gi.go_enrichment( 2 # Use human taxid as a start 3 gene_list, 4 alpha=0.05, 5 terms=go_terms) File ~/miniconda3/envs/hic/lib/python3.12/site-packages/geneinfo/__init__.py:1780, in go_enrichment(gene_list, taxid, background_chrom, background_genes, terms, list_study_genes, alpha) 1777 GeneID2nt = background_genes.GENEID2NT 1779 if not all(type(x) is int for x in gene_list): -> 1780 gene_list = _cached_symbol2ncbi(gene_list, taxid=taxid) 1782 goeaobj = GOEnrichmentStudyNS( 1783 GeneID2nt, # List of mouse protein-coding genes 1784 ns2assoc, # geneid/GO associations (...) 1788 methods=['fdr_bh'], 1789 pvalcalc='fisher_scipy_stats') 1791 goea_results_all = goeaobj.run_study(gene_list) File ~/miniconda3/envs/hic/lib/python3.12/site-packages/geneinfo/__init__.py:1058, in _cached_symbol2ncbi(symbols, taxid) 1056 except KeyError: 1057 try: -> 1058 ncbi_id = hgcn_symbol(symbol) 1059 if ncbi_id not in symbol2ncbi.index: 1060 print(ncbi_id, 'not in symbol2ncbi index') File ~/miniconda3/envs/hic/lib/python3.12/site-packages/geneinfo/__init__.py:256, in hgcn_symbol(name) 254 return [ensembl2symbol(ensembl_id(n)) for n in name] 255 else: --> 256 return ensembl2symbol(ensembl_id(name)) File ~/miniconda3/envs/hic/lib/python3.12/site-packages/geneinfo/__init__.py:227, in ensembl2symbol(ensembl_id) 225 r = requests.get(server+ext, headers={ "Content-Type" : "application/json"}) 226 if not r.ok: --> 227 r.raise_for_status() 228 decoded = r.json() 229 symbols = [x['display_id'] for x in decoded if x['dbname'] == 'HGNC'] File ~/miniconda3/envs/hic/lib/python3.12/site-packages/requests/models.py:1024, in Response.raise_for_status(self) 1019 http_error_msg = ( 1020 f"{self.status_code} Server Error: {reason} for url: {self.url}" 1021 ) 1023 if http_error_msg: -> 1024 raise HTTPError(http_error_msg, response=self) HTTPError: 400 Client Error: Bad Request for url: https://rest.ensembl.org/xrefs/id/%5B'ENSG00000207758'%5D