import pandas as pd
import os

# Directory containing your .csv files
csv_dir = '../results/compartments/'

# Create a dictionary to store the DataFrames
dataframes = {}

# Iterate over all .csv files in the directory
for filename in os.listdir(csv_dir):
    if filename.endswith('.csv'):  # Check for .csv files
        # Construct the full file path
        filepath = os.path.join(csv_dir, filename)

        # Load the CSV into a DataFrame
        # Use the filename (without extension) as the dictionary key
        key = filename.replace('_a_comp_coords_', '_')
        key = os.path.splitext(key)[0]
        dataframes[key] = pd.read_csv(filepath)
        dataframes[key]['length'] = dataframes[key]['end'] - dataframes[key]['start']

# The `dataframes` dictionary now contains the DataFrames
dataframes.keys()

ech90 = pd.read_csv('../data/ech90_human_Mmul_10.csv')
ech90['length'] = ech90['end'] - ech90['start']E1 vs. ECH
Overlaying the A-Compartments with Extended Common Haplotypes
The genomic regions in question
In 03_compartments.ipynb we extracted the genomic intervals of A compartments on all cell types in all combinations of the following parameters:
- Cell type: fibroblast, spermatocyte, pachytene spermatocyte, round spermatid, sperm
- Chromosome: X
- E1 restriction: full-chromosome, chromosome arms, 10Mb windows
- Resolution: 100 kb, 500 kb
The following parameter was only changed for 100kb resolution:
- Smoothing: No smoothing, 5 bins (500kb)
Resulting in 45 .csv files. They are saved to ../results/compartments/.
Load the data
Time to unleash genominterv on the .csv files
Define a plotting function
# Kaspers plotting function

import pandas as pd
import matplotlib.pyplot as plt
import numpy as np

%config InlineBackend.figure_format = 'svg'

def plot_intervals(query=None, annot=None, **kwargs):

    tups = []
    if query is not None:
        tups.append(('query', query))
    if annot is not None:
        tups.append(('annot', annot))
    tups.extend(kwargs.items())
    tups = reversed(tups)

    df_list = []
    labels = []
    for label, df in tups:
        labels.append(label)
        df['label'] = label
        df_list.append(df)
    bigdf = pd.concat(df_list)

    bigdf['chrom'] = pd.Categorical(bigdf['chrom'], bigdf['chrom'].unique())
    bigdf['label'] = pd.Categorical(bigdf['label'], bigdf['label'].unique())

    gr = bigdf.groupby('chrom', observed=False)
    fig, axes = plt.subplots(gr.ngroups, 1, figsize=(8, 1.5*gr.ngroups),
                            sharey=True
                            #  sharex=True
                             )
    if type(axes) is not np.ndarray:
        # in case there is only one axis so it not returned as a list
        axes = np.array([axes])

    # with plt.style.context(('default')):

    for i, chrom in enumerate(gr.groups):
        _df = gr.get_group(chrom)
        _gr = _df.groupby('label', observed=False)
        for y, label in enumerate(_gr.groups):
            try:
                df = _gr.get_group(label)
            except KeyError:
                continue
            y = np.repeat(y, df.index.size)
            axes[i].hlines(y, df.start.tolist(), df.end.tolist(), alpha=0.5, lw=5, colors=f'C{y[0]}')
            delta = len(labels)/10
            axes[i].vlines(df.start.tolist(), y-delta, y+delta, alpha=0.5, lw=2, colors=f'C{y[0]}')
            axes[i].vlines(df.end.tolist(), y-delta, y+delta, alpha=0.5, lw=2, colors=f'C{y[0]}')

        axes[i].spines['top'].set_visible(False)
        axes[i].spines['left'].set_visible(False)
        axes[i].spines['right'].set_visible(False)

        axes[i].set_yticks(list(range(len(labels))), labels)
        axes[i].tick_params(axis='y', which='both', left=False)
        axes[i].set_ylim(-1, len(labels)-0.7)
        # axes[i].set_xlim(df.start.min()-delta, df.end.max()+delta)
        if i != gr.ngroups-1:
            axes[i].tick_params(axis='x', which='both', bottom=False)

        axes[i].set_title(chrom, loc='left', fontsize=10)
    plt.tight_layout()
# My plotting function
import matplotlib.pyplot as plt
import numpy as np
import pandas as pd
from matplotlib.patches import Rectangle
from mpl_toolkits.axes_grid1 import make_axes_locatable
from genominterv import interval_intersect
%config InlineBackend.figure_format = 'svg'
def plot_regions(query=None, annot=None, intersect=None):
chrom = annot['chrom'].unique()[0]
chromsize = pd.read_csv('../data/rheMac10.filtered.chrom.sizes', sep='\t', header=None, names=['chrom', 'size'])
chromsize = chromsize[chromsize['chrom'] == chrom]['size'].values[0]
# Define the plot
height = 1 + (1 if query is not None else 0) + (1 if intersect is not None else 0)
height = height * 0.75
f, ax = plt.subplots(figsize=(10, height), sharex=True)
ax.spines[:].set_visible(False)
# Plot the annot
# Iterate over each interval in the DataFrame
for start, end in zip(annot['start'], annot['end']):
rect = Rectangle((start, 0.1), width=end-start, height=0.9, color='tab:red', linewidth=0, alpha=0.6)
ax.add_patch(rect)
ax.spines['bottom'].set_visible(True)
lbl = annot['label'].unique()[0] if 'label' in annot.columns else 'A-Comp'
ax.set_ylabel(lbl, rotation=0, fontsize=10, labelpad=30)
divider = make_axes_locatable(ax)
if query is not None:
qax = divider.append_axes("top", size="100%", pad=0.2, sharex=ax)
qax.xaxis.set_visible(False)
# Plot the query
for start, end in zip(query['start'], query['end']):
rect = Rectangle((start, 0.1), width=end-start, height=0.9, color='tab:blue', linewidth=0, alpha=0.6)
qax.add_patch(rect)
qax.spines[:].set_visible(False)
qax.set_yticks([])
qax.set_title(chrom, loc='left', fontsize=10)
qax.set_ylabel('ECH90', rotation=0, fontsize=10, labelpad=30)
if intersect is not None:
iax = divider.append_axes("bottom", size="100%", pad=0.2, sharex=ax)
# Invisible x-axis for 'annot' (intersect ie below)
ax.xaxis.set_visible(False)
# Plot the intersect
for start, end in zip(intersect['start'], intersect['end']):
rect = Rectangle((start, 0.1), width=end-start, height=0.9, color='tab:green', linewidth=0, alpha=0.6)
iax.add_patch(rect)
iax.spines[:].set_visible(False)
iax.set_yticks([])
ax.spines['bottom'].set_visible(False)
iax.spines['bottom'].set_visible(True)
iax.set_ylabel('Intersect', rotation=0, fontsize=10, labelpad=30)
ax.set_yticks([])
ax.set_xlim(0, chromsize)
ticks = np.linspace(0, chromsize, num=5)
ax.set_xticks(ticks)
ax.set_xticklabels([f'{int(t/1e6)} Mbp' for t in ticks])
plt.tight_layout()
return f, ax
Test with a subsample of the data
annot = dataframes['round_spermatid_100kb_arms']
query = ech90
intersect = interval_intersect(annot, query)

plot_intervals(query, annot, intersection=intersect)
plot_regions(query, annot, intersect)

from genominterv import proximity_test, interval_collapse, interval_diff, interval_intersect, jaccard_stat

annot = dataframes['round_spermatid_100kb_arms']
query = ech90

#plot_intervals(query=query, annot=annot)

for key,annot in dataframes.items():
    # Filter out subset
    if ('round_spermatid_100') in key and not 'full' in key:
        # Plot the intervals
        intersection = interval_intersect(query, annot)
        plot_intervals(query=query, annot=annot, intersection=intersection)
        plt.title(key)

        # Do a proximity test
        print(f"Tests for {key}")
        annot_collapsed = interval_collapse(annot)
        non_ovl_query = interval_diff(query, annot_collapsed)
        print("Proximity:", proximity_test(non_ovl_query, annot_collapsed))
        print("Jaccard:", jaccard_stat(query, annot))
        print()
Tests for round_spermatid_100kb_arms_smoothed
Proximity: TestResult(statistic=0.20566666666666641, pvalue=0.105)
Jaccard: 0.03319511172796144

Tests for round_spermatid_100kb_arms
Proximity: TestResult(statistic=0.49242857142857144, pvalue=0.0004)
Jaccard: 0.03916232332293147

Tests for round_spermatid_100kb_10Mb
Proximity: TestResult(statistic=0.3223076923076922, pvalue=0.0209)
Jaccard: 0.04512778341139746

Tests for round_spermatid_100kb_10Mb_smoothed
Proximity: TestResult(statistic=0.4658333333333337, pvalue=0.0017)
Jaccard: 0.04494391747197651


Bootstrap to get a p-value
from genominterv import bootstrap

annot = dataframes['round_spermatid_100kb_arms']
chromsizes = (
    pd.read_csv('../data/rheMac10.filtered.chrom.sizes',
                sep='\t',
                index_col='chrom',
                header=None,
                names=['chrom','size'])
    .to_dict()['size']
)
#display(chromsizes)

@bootstrap(chromsizes, samples=1000)
def jaccard_bootstrap(query, annot):
    return jaccard_stat(query, annot)

jacccard_stat, p_value = jaccard_bootstrap(query, annot)
jacccard_stat, p_value(0.03916232332293147, 0.31)Partition the A-compartments into regions around the edges
df = dataframes['round_spermatid_100kb_arms']

start_edge = pd.DataFrame({
    'chrom': df['chrom'],
    'start': df['start']-1*df['resolution'],
    'end': df['start']+1*df['resolution'],
    'resolution': df['resolution'],
    'label': 'start_edge'
})
end_edge = pd.DataFrame({
    'chrom': df['chrom'],
    'start': df['end']-1*df['resolution'],
    'end': df['end']+1*df['resolution'],
    'resolution': df['resolution'],
    'label': 'end_edge'
})

#df
test_df = pd.concat([start_edge, end_edge]).sort_values(['chrom', 'start', 'end'])
interval_collapse(test_df)| start | end | chrom | |
|---|---|---|---|
| 0 | 800000 | 1000000 | chrX |
| 1 | 2500000 | 2700000 | chrX |
| 2 | 3100000 | 3300000 | chrX |
| 3 | 3400000 | 3600000 | chrX |
| 4 | 6500000 | 6800000 | chrX |
| ... | ... | ... | ... |
| 86 | 147000000 | 147200000 | chrX |
| 87 | 148800000 | 149400000 | chrX |
| 88 | 150800000 | 151000000 | chrX |
| 89 | 152200000 | 152400000 | chrX |
| 90 | 153200000 | 153400000 | chrX |
91 rows × 3 columns
import os

for key, df in dataframes.items():
    outdir = '../results/edges'
    edge_csv_name = os.path.join(outdir,f'{key+'_edges.csv'}')
    if not os.path.exists(edge_csv_name):
        res = df['resolution'].unique()[0]

        start_edge = pd.DataFrame({
            'chrom': df['chrom'],
            'start': df['start']-1*df['resolution'],
            'end': df['start']+1*df['resolution'],
            'resolution': df['resolution'],
            'label': 'start_edge'
        })
        end_edge = pd.DataFrame({
            'chrom': df['chrom'],
            'start': df['end']-1*df['resolution'],
            'end': df['end']+1*df['resolution'],
            'resolution': df['resolution'],
            'label': 'end_edge'
        })

        if not os.path.exists(outdir):
            os.makedirs(outdir)

        tmp = pd.concat([start_edge, end_edge]).sort_values(['chrom', 'start', 'end'])
        interval_collapse(tmp).assign(resolution=res).to_csv(edge_csv_name, index=False)
Import edges
import pandas as pd
import os

# Directory containing your .csv files
csv_dir = '../results/edges/'

# Create a dictionary to store the DataFrames
edges = {}

# Iterate over all .csv files in the directory
for filename in os.listdir(csv_dir):
    if filename.endswith('.csv'):  # Check for .csv files
        # Construct the full file path
        filepath = os.path.join(csv_dir, filename)

        # Load the CSV into a DataFrame
        # Use the filename (without extension) as the dictionary key
        key = filename.replace('_edges_', '')
        key = os.path.splitext(key)[0]
        edges[key] = pd.read_csv(filepath)
        edges[key]['length'] = edges[key]['end'] - edges[key]['start']

# The `edges` dictionary now contains the DataFrames
print(edges.keys())
print(edges['fibroblast_100kb_10Mb_edges'].columns)

#ech90 = pd.read_csv('../data/ech90_human_Mmul_10.csv')
dict_keys(['sperm_100kb_arms_smoothed_edges', 'spermatogonia_500kb_full_edges', 'pachytene_spermatocyte_100kb_10Mb_smoothed_edges', 'spermatogonia_100kb_arms_edges', 'fibroblast_500kb_full_edges', 'round_spermatid_500kb_10Mb_edges', 'fibroblast_100kb_arms_edges', 'spermatogonia_100kb_full_smoothed_edges', 'round_spermatid_100kb_full_smoothed_edges', 'round_spermatid_100kb_full_edges', 'fibroblast_100kb_10Mb_edges', 'round_spermatid_500kb_arms_edges', 'fibroblast_100kb_full_smoothed_edges', 'spermatogonia_100kb_10Mb_edges', 'sperm_500kb_arms_edges', 'spermatogonia_100kb_10Mb_smoothed_edges', 'sperm_100kb_full_edges', 'pachytene_spermatocyte_500kb_10Mb_edges', 'pachytene_spermatocyte_100kb_full_smoothed_edges', 'pachytene_spermatocyte_100kb_full_edges', 'pachytene_spermatocyte_500kb_arms_edges', 'fibroblast_100kb_10Mb_smoothed_edges', 'sperm_500kb_10Mb_edges', 'round_spermatid_100kb_10Mb_smoothed_edges', 'spermatogonia_500kb_arms_edges', 'spermatogonia_100kb_full_edges', 'spermatogonia_100kb_arms_smoothed_edges', 'fibroblast_500kb_arms_edges', 'round_spermatid_100kb_10Mb_edges', 'fibroblast_100kb_full_edges', 'sperm_100kb_full_smoothed_edges', 'fibroblast_100kb_arms_smoothed_edges', 'round_spermatid_100kb_arms_edges', 'fibroblast_500kb_10Mb_edges', 'round_spermatid_500kb_full_edges', 'round_spermatid_100kb_arms_smoothed_edges', 'spermatogonia_500kb_10Mb_edges', 'sperm_500kb_full_edges', 'sperm_100kb_10Mb_smoothed_edges', 'sperm_100kb_arms_edges', 'pachytene_spermatocyte_100kb_arms_smoothed_edges', 'pachytene_spermatocyte_100kb_10Mb_edges', 'pachytene_spermatocyte_100kb_arms_edges', 'pachytene_spermatocyte_500kb_full_edges', 'sperm_100kb_10Mb_edges'])
Index(['chrom', 'start', 'end', 'resolution', 'label', 'length'], dtype='object')from genominterv import interval_intersect
sample = 'round_spermatid_100kb_arms'
full_df = dataframes[sample]
full_intersect = interval_intersect(full_df, ech90).assign(length=lambda x: x['end'] - x['start'])
edge_df = edges[f'{sample}_edges']
# Plot full
plot_regions(ech90, full_df, full_intersect)
plt.suptitle('All edges')Text(0.5, 0.98, 'All edges')
### Some stats about the data and intersections ###

# Determine the proportion of total regions in ECH90 that lies on compartment edges

print("Proportion of ECH90 on edges (#count)")

# Proportion of ECH90 on full regions
print(f'\t{full_intersect.shape[0] / ech90.shape[0]}')


print("\nProportion of ECH90 on edges (#bpairs)")

# Proportion of ECH90 on full regions
print(f'\t{full_intersect['length'].sum() / ech90['length'].sum()}')


# What is the total length of ech90 regions
print("\nTotal length of:")
print(f'\tECH90:  {(ech90['end'] - ech90['start']).sum()} bp')
print(f'\tEdges: {(edge_df["end"] - edge_df["start"]).sum()} bp')
Proportion of ECH90 on edges (#count)
0.631578947368421
Proportion of ECH90 on edges (#bpairs)
0.3932398045966063
Total length of:
ECH90: 5511675 bp
Edges: 28800000 bpf, ax = plot_regions(edge_df, ech90, full_intersect)
for ax in list(f.axes):
if ax.get_ylabel() == 'ECH90':
ax.set_ylabel('edge_df', rotation=0, fontsize=10, labelpad=30)
if ax.get_ylabel() == "query":
ax.set_ylabel('ECH90', rotation=0, fontsize=10, labelpad=30)
if ax.get_ylabel() == 'Intersect':
#ax.set_ylabel('end_edge \nintersect', rotation=0, fontsize=10, labelpad=30)
pass

Do testing of the edges
%%capture
# Define what we are testing

print("""
Goal: To test whether ECH90 regions are enriched in compartment edges
Query: ECH90
Annotation: Start and end edges of compartments

Hypothesis:
      ECH90 regions are enriched in compartment edges
Null hypothesis:
      ECH90 regions are not enriched in compartment edges

Tests:
* Proximity test:
      tests whether the query regions are closer to
      the annotation regions than expected by chance.
      NB regions can not overlap, so we need to collapse the annotation regions

* Jaccard index:
      tests the similarity between the query and annotation regions,
      where a value of 1 indicates perfect overlap
""")
### Proximity test ###
from genominterv import proximity_test, interval_collapse, interval_diff, interval_intersect
# Define the query and annotation
query = ech90
annot = full_intersect
# Calculate the non-overlapping query regions
non_ovl_query_full = interval_diff(query, annot)
# Perform the proximity test
proximity_full = proximity_test(non_ovl_query_full, annot, two_sided=False)
print("Proximity test results: All edges")
print(f"\tstatistic: {proximity_full.statistic}, \n\tp-value: {proximity_full.pvalue}")Proximity test results: All edges
statistic: 0.6821666666666665,
p-value: 0.0### Jaccard index ###
from genominterv import jaccard_stat, bootstrap
chromsizes = (pd.read_csv(
'../data/rheMac10.filtered.chrom.sizes',
sep='\t',
index_col='chrom',
header=None,
names=['chrom','size'])
.to_dict()['size']
)
# # Calculate the Jaccard index
# jaccard_start = jaccard_stat(query, annot_start)
# jaccard_end = jaccard_stat(query, annot_end)
# jaccard_concat = jaccard_stat(query, annot_concat)
# print("\nJaccard index results")
# print(f"Start edge: {jaccard_start}")
# print(f"End edge: {jaccard_end}")
# print(f"Concat edge: {jaccard_concat}")
# Test with bootstrap decorator
@bootstrap(chromsizes, samples=1000)
def jaccard_bootstrap(query, annot):
return jaccard_stat(query, annot)
jaccard_stat_full, p_value_full = jaccard_bootstrap(query,annot)
print(f"Jaccard index: {jaccard_stat_full}, p-value: {p_value_full}")Jaccard index: 0.3932398045966063, p-value: 0.0p-value is zero smaller than 0.001. Increase nr samples to get actual p-value.Check the length of the intervals
# Plot histogram of the lengths of the A compartments from the full regions

full_df['length'] = full_df['end'] - full_df['start']
full_df['length'].mean()

plt.figure()
full_df['length'].hist(bins=20)
plt.show()

plt.figure()
(ech90['end']-ech90['start']).hist(bins=10)
plt.show()

Bioframe genomic intervals support
import bioframe Geneinfo
How does the edges align with genes?
This first plot is just to figure out how to plot with gene_plot.
import geneinfo as gi
from matplotlib.patches import Rectangle
from matplotlib.collections import PatchCollection


# Use the proximity test results to plot the ECH90 regions and the compartment edges

start = full_intersect['start'][2]
end = full_intersect['end'][5]

rectangles = [Rectangle((start, 0.1), width=end-start, height=0.9, color='tab:green', linewidth=0, alpha=0.6) for start, end in zip(full_intersect['start'][2:6], full_intersect['end'][2:6])]

pc = PatchCollection(rectangles, match_original=True)

ax = gi.gene_plot('chrX', start-100_000, end+100_000, assembly='rheMac10')
ax.add_collection(pc)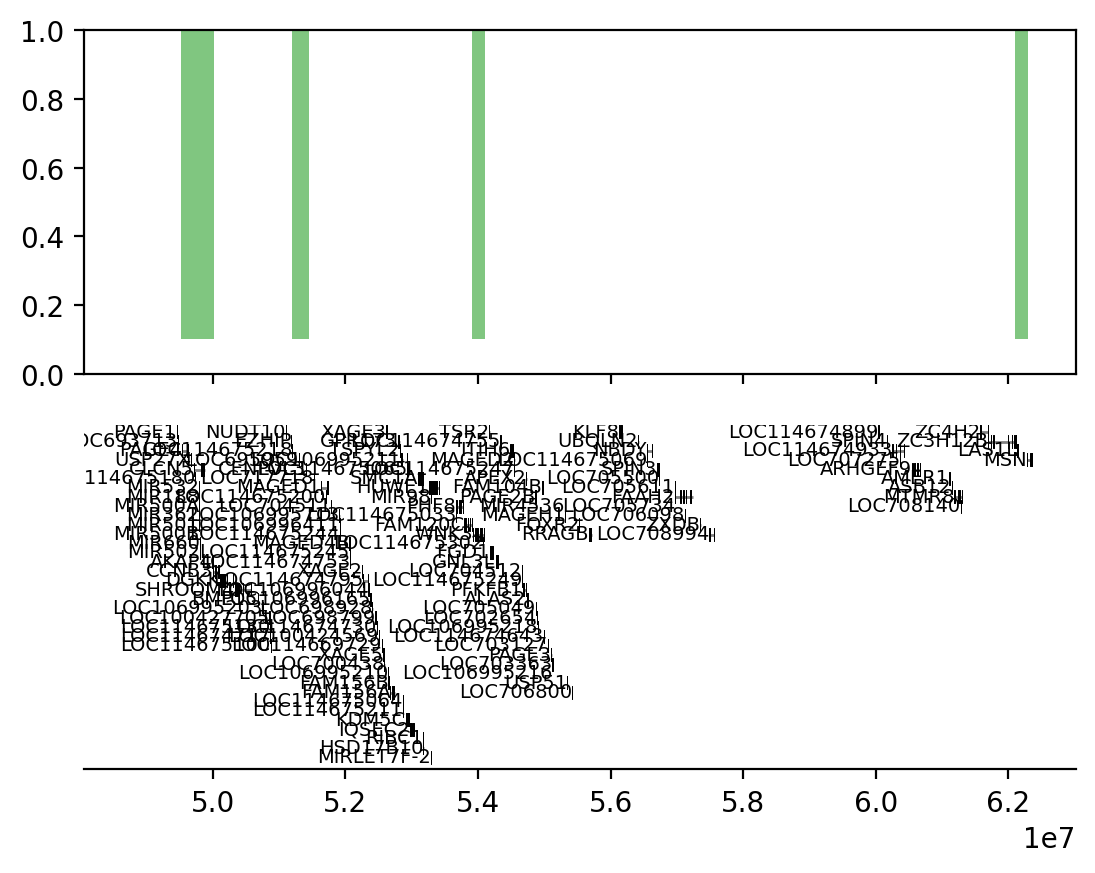
Get the geneinfo for all intersections between edges and ECH90
And write to a csv file. If the file exists, read it with pandas.
# Use get_genes_region
import os.path as op
import geneinfo as gi
import pandas as pd

genes_file = '../results/edge_genes/rs_edges_100kb_genes.csv'

if not op.exists(genes_file):
    genes = pd.concat(
        full_intersect.apply(
            lambda x: gi.get_genes_region_dataframe('chrX', x['start'], x['end'], assembly='rheMac10'),
            axis =1
            ).to_list(),
        ignore_index=True
    )
    genes.to_csv(genes_file, index=False)
else:
    genes = pd.read_csv(genes_file)
genes_list = genes['name'].unique().tolist()
genes_list['SH3KBP1',
'MIR7206',
'LANCL3',
'XK',
'CYBB',
'LOC696657',
'DYNLT3',
'PAGE4',
'USP27X',
'CLCN5',
'LOC114675180',
'MIR532',
'MIR188',
'MIR500A',
'MIR362',
'MIR501',
'MIR500B',
'MIR660',
'MIR502',
'AKAP4',
'CCNB3',
'LOC114675218',
'LOC695959',
'CENPVL3',
'FAM120C',
'WNK3',
'LOC114675302',
'ZC3H12B',
'LAS1L',
'MSN',
'ATRX',
'MAGT1',
'LOC114675151',
'COX7B',
'ATP7A',
'ALG13',
'RAP2C',
'DKC1',
'LOC114675231',
'MPP1',
'SMIM9',
'F8']import geneinfo as gi
from matplotlib.patches import Rectangle
from matplotlib.collections import PatchCollection
# Use the proximity test results to plot the ECH90 regions and the compartment edges
start_idx = 10
end_idx = 11
start = full_intersect['start'][start_idx]
end = full_intersect['end'][end_idx]
rectangles = [Rectangle(
(start, 0.1), width=end-start, height=0.9, color='tab:green', linewidth=0, alpha=0.6) for start, end in zip(full_intersect['start'][start_idx:end_idx+1], full_intersect['end'][start_idx:end_idx+1])]
pc = PatchCollection(rectangles, match_original=True)
ax = gi.gene_plot('chrX', start-100_000, end+100_000, assembly='rheMac10',
highlight=genes_list,
despine=True,
figsize=(12, 5),
aspect=5,
)
ax.add_collection(pc)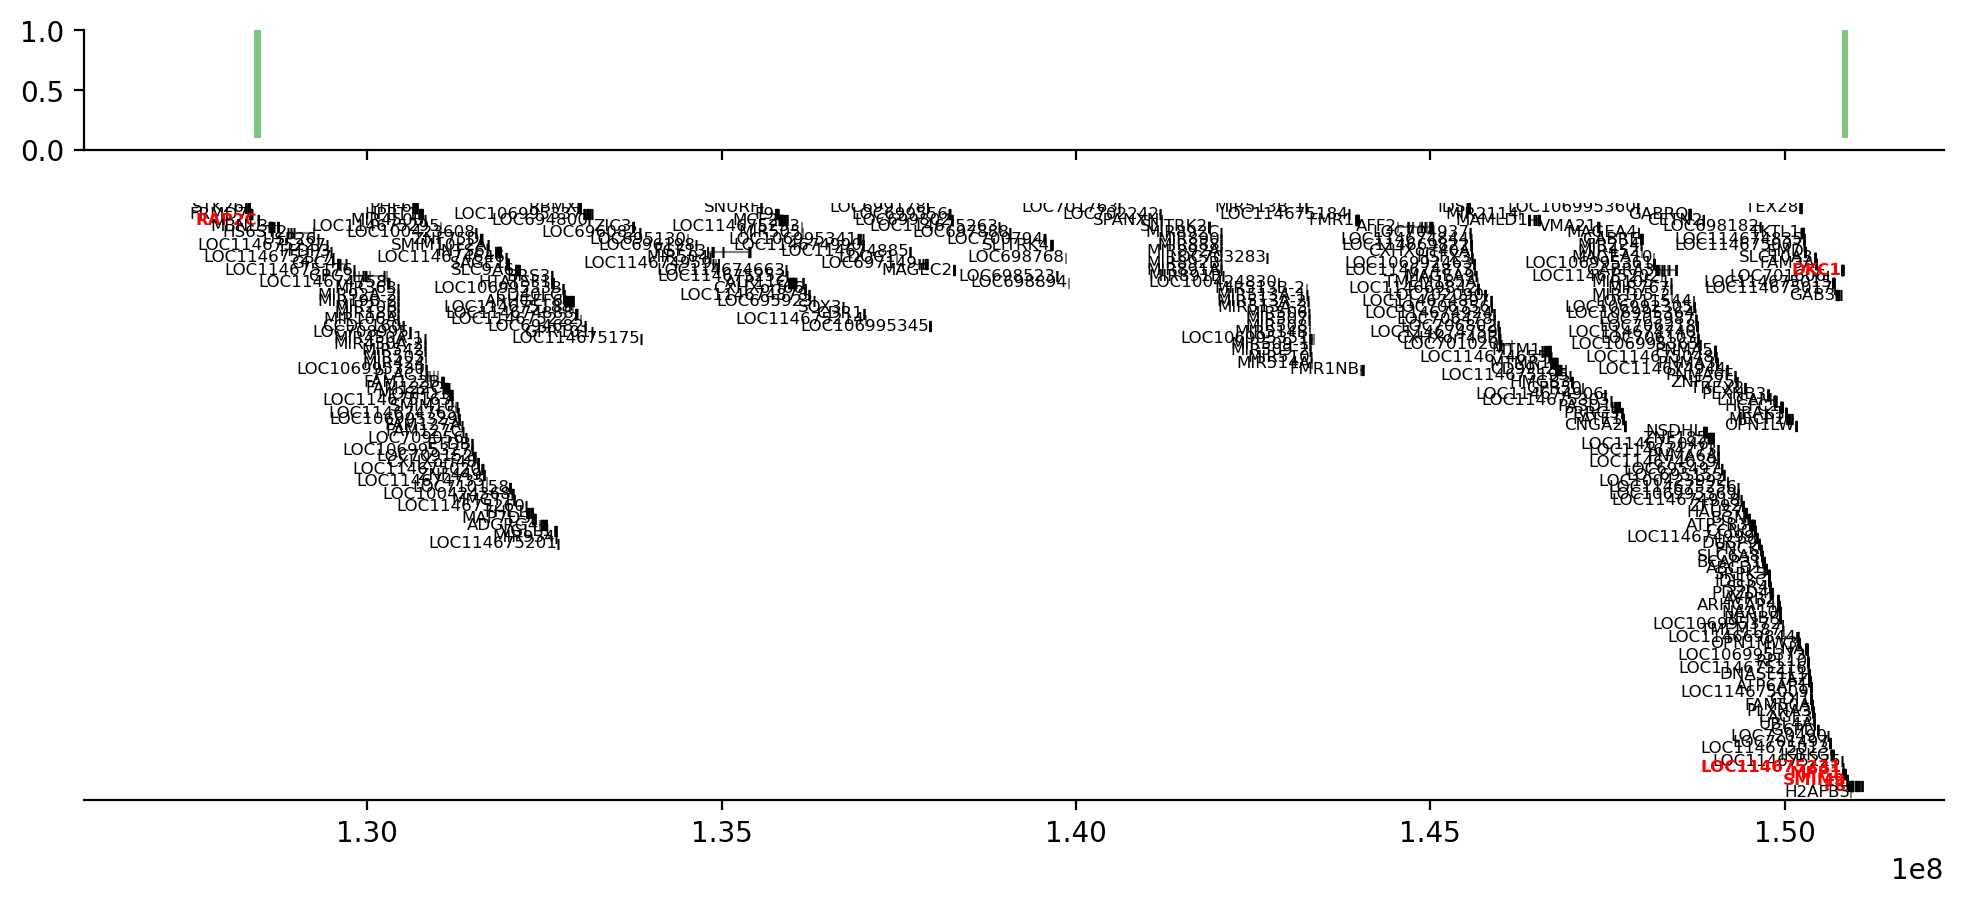
What can I do with the list of genes on the edges?
GO enrichment?
mmul_x_genes = gi.get_genes_region_dataframe('chrX', 0, 155_000_000, assembly='rheMac10')mmul_x_genelist = mmul_x_genes['name'].unique().tolist()gene_list = genes['name'].unique().tolist()
taxid = 9544
gi.email('sojernj@gmail.com')
#gi.go_annotation_table(taxid=taxid)
#gi.show_go_evidence_codes()
go_terms = gi.get_go_terms_for_genes(gene_list, taxid=taxid)len(go_terms)
#gene_list[:5]98results = gi.go_enrichment(
gene_list[:5],
# Use human as a start
alpha=0.05,
terms=go_terms
)geneinfo_cache/go-basic.obo: fmt(1.2) rel(2024-10-27) 44,017 Terms; optional_attrs(def relationship)Could not map gene symbol "MIR7206" to ncbi id