from phasic import Graph, with_ipv # ALWAYS import phasic first
import sys
import numpy as np
from vscodenb import set_vscode_theme
set_vscode_theme()Visualizing state space
@with_ipv([1, 1])
def mesh(state, max_val=2):
    transitions = []
    for i in range(state.size):
        if state[i] <= max_val:
            child = state.copy()
            child[i] += 1
            trans = [child, state.sum()]
            transitions.append(trans)
    return transitions

graph = Graph(mesh)
graph.plot()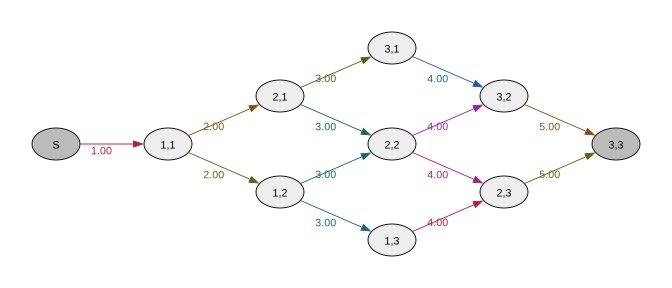
Change node separation from the default of 1:
graph.plot(nodesep=0.5)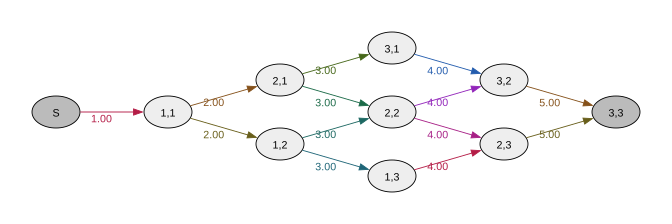
Also change the separation of nodes with different rank from the default of 1:
graph.plot(nodesep=0.5, ranksep=0.5)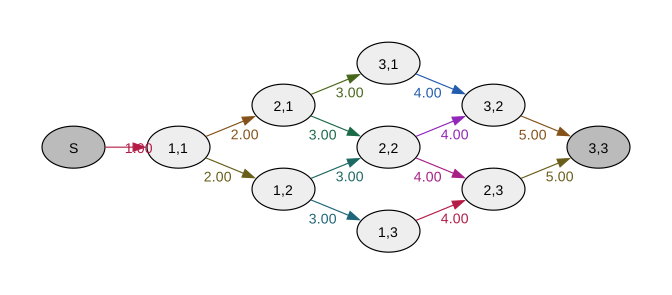
Plot node rank top to bottom (TB) rather than default left to right (LR):
graph.plot(rankdir="TB", ranksep=0.3)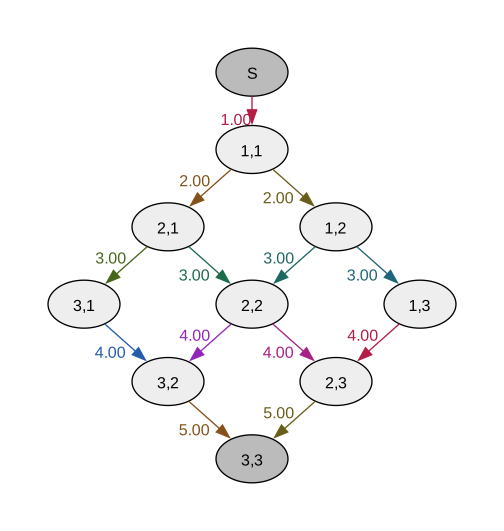
Width of edges, size of font, unicolor, and size of figure:
graph.plot(size=(7, 5), fontsize=30, rainbow=False, penwidth=5)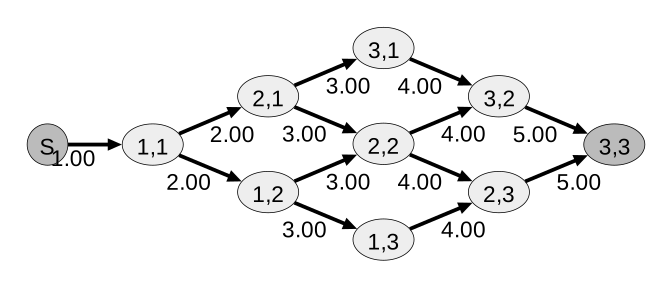
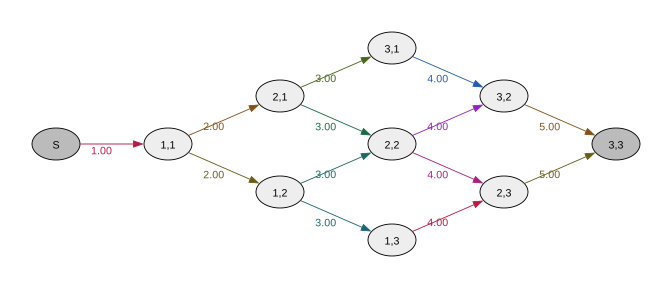
graph.plot(size=(7, 5),
           fontsize=20, rainbow=False, label_fmt=False, taillabel=True,
           rate_fmt=lambda rate: f'''< <table bgcolor="white" border="0"><tr><td>{rate}</td></tr></table> >''',
           edge_attr=dict(penwidth=3, labelfontcolor='blue', labeldistance=3, labelangle=0),
           node_attr=dict(shape='circle', fillcolor='white', penwidth=2.5, fixedsize=True, width=1)
           )
Save to file
Subgraphs
def fun(state):
    return f'First index\nvalue: {state[0]}'

graph.plot(by_state=fun)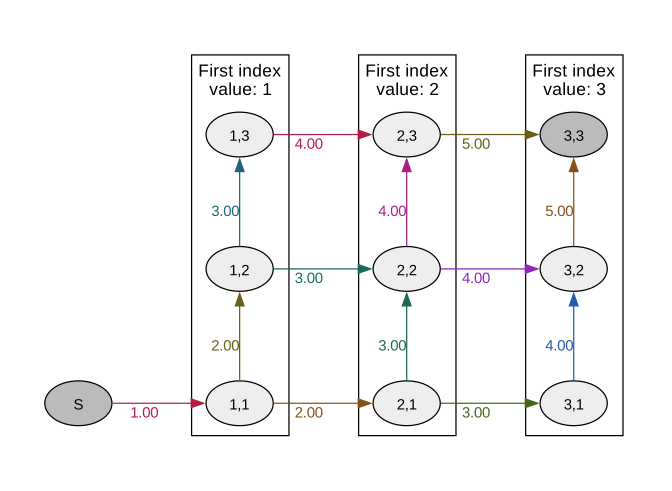
def fun(index):
    return f"{'Uneven' if index % 2 else 'Even'}\nvertex index"

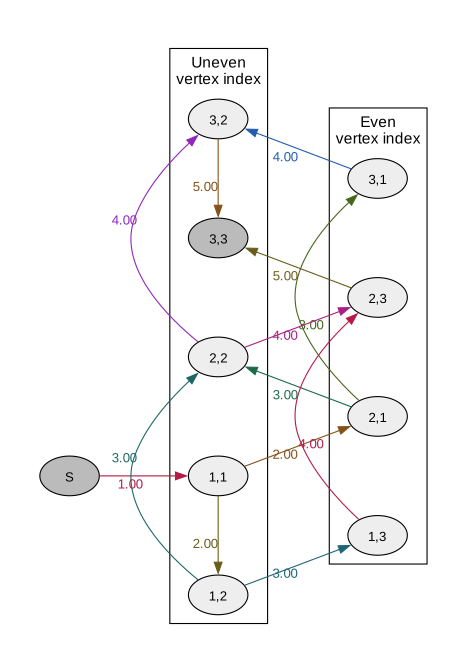
graph.plot(by_index=fun)