32 Aardvark?
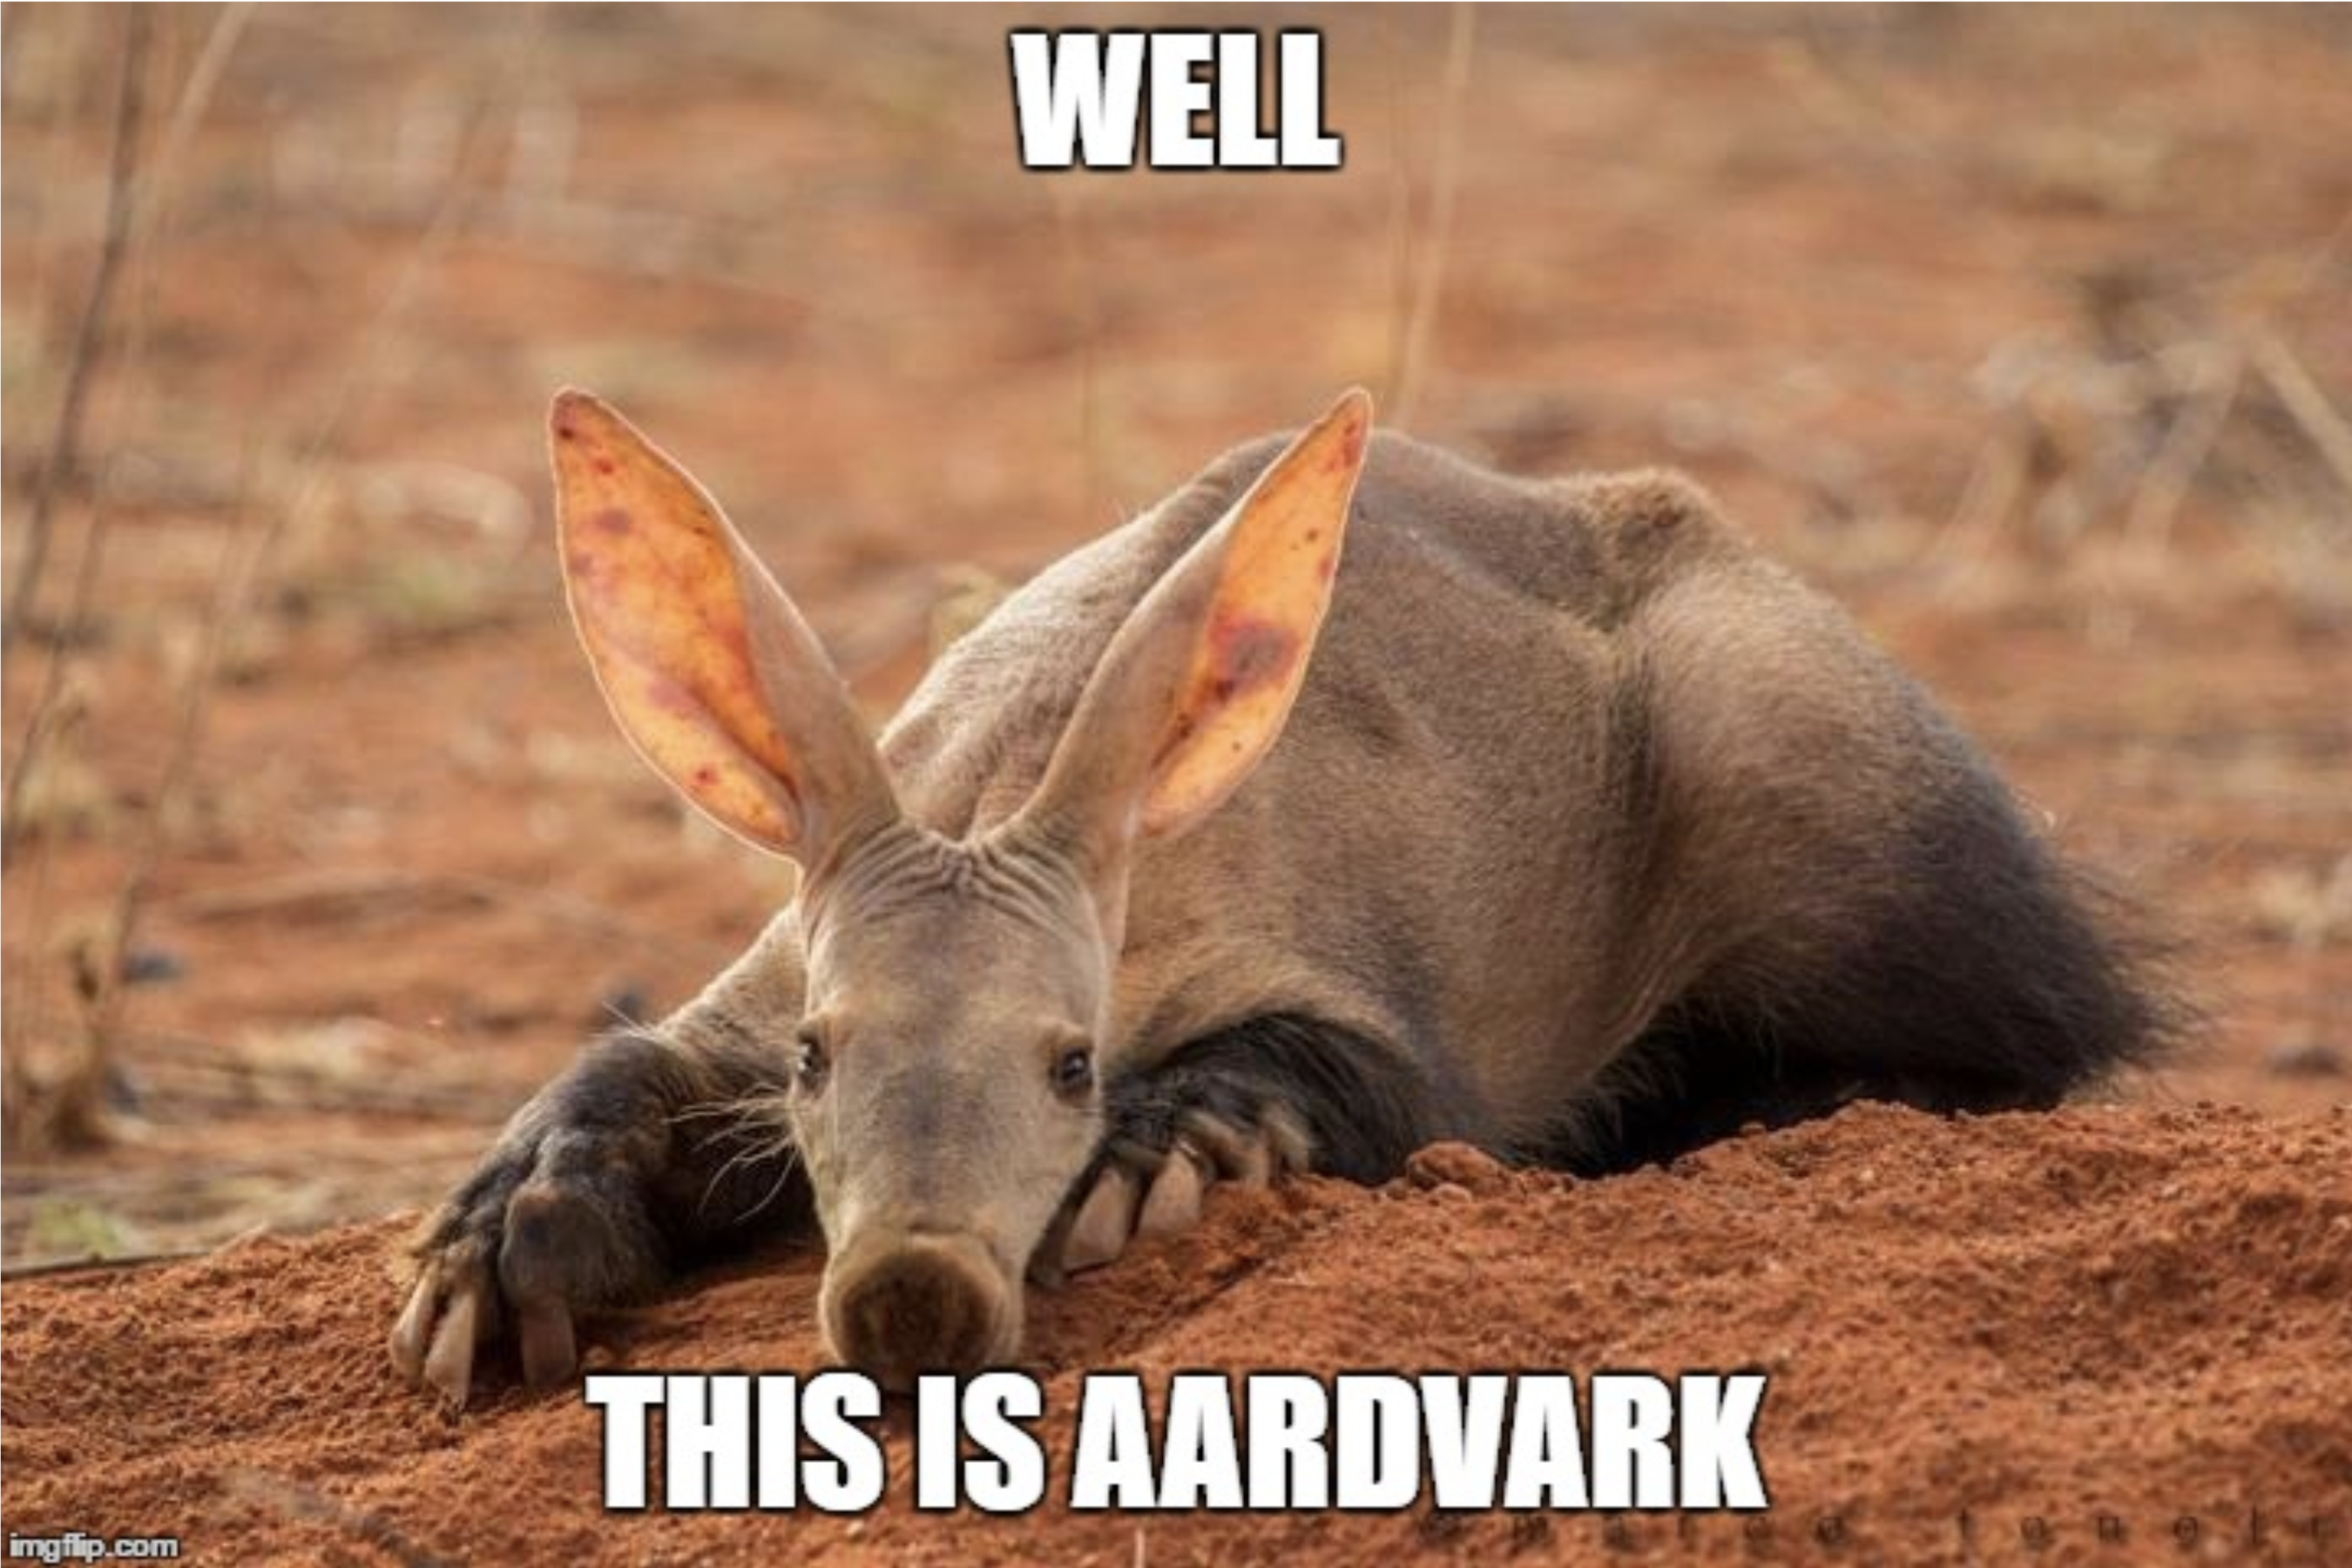
“What is an Aardvark?” You may have bugged you for a while. It might have kept you up at night. You might have been twisting and turning due to the mystery that is the Aardvark. But fear not. Today, you will attempt to answer this exact question. Or at least a part of the question from a phylogenetic perspective. In the process, hopefully, you will learn something about phylogeny. Let’s start with a more straightforward question. “What does the Aardvark look like?”, Figure 32.1.

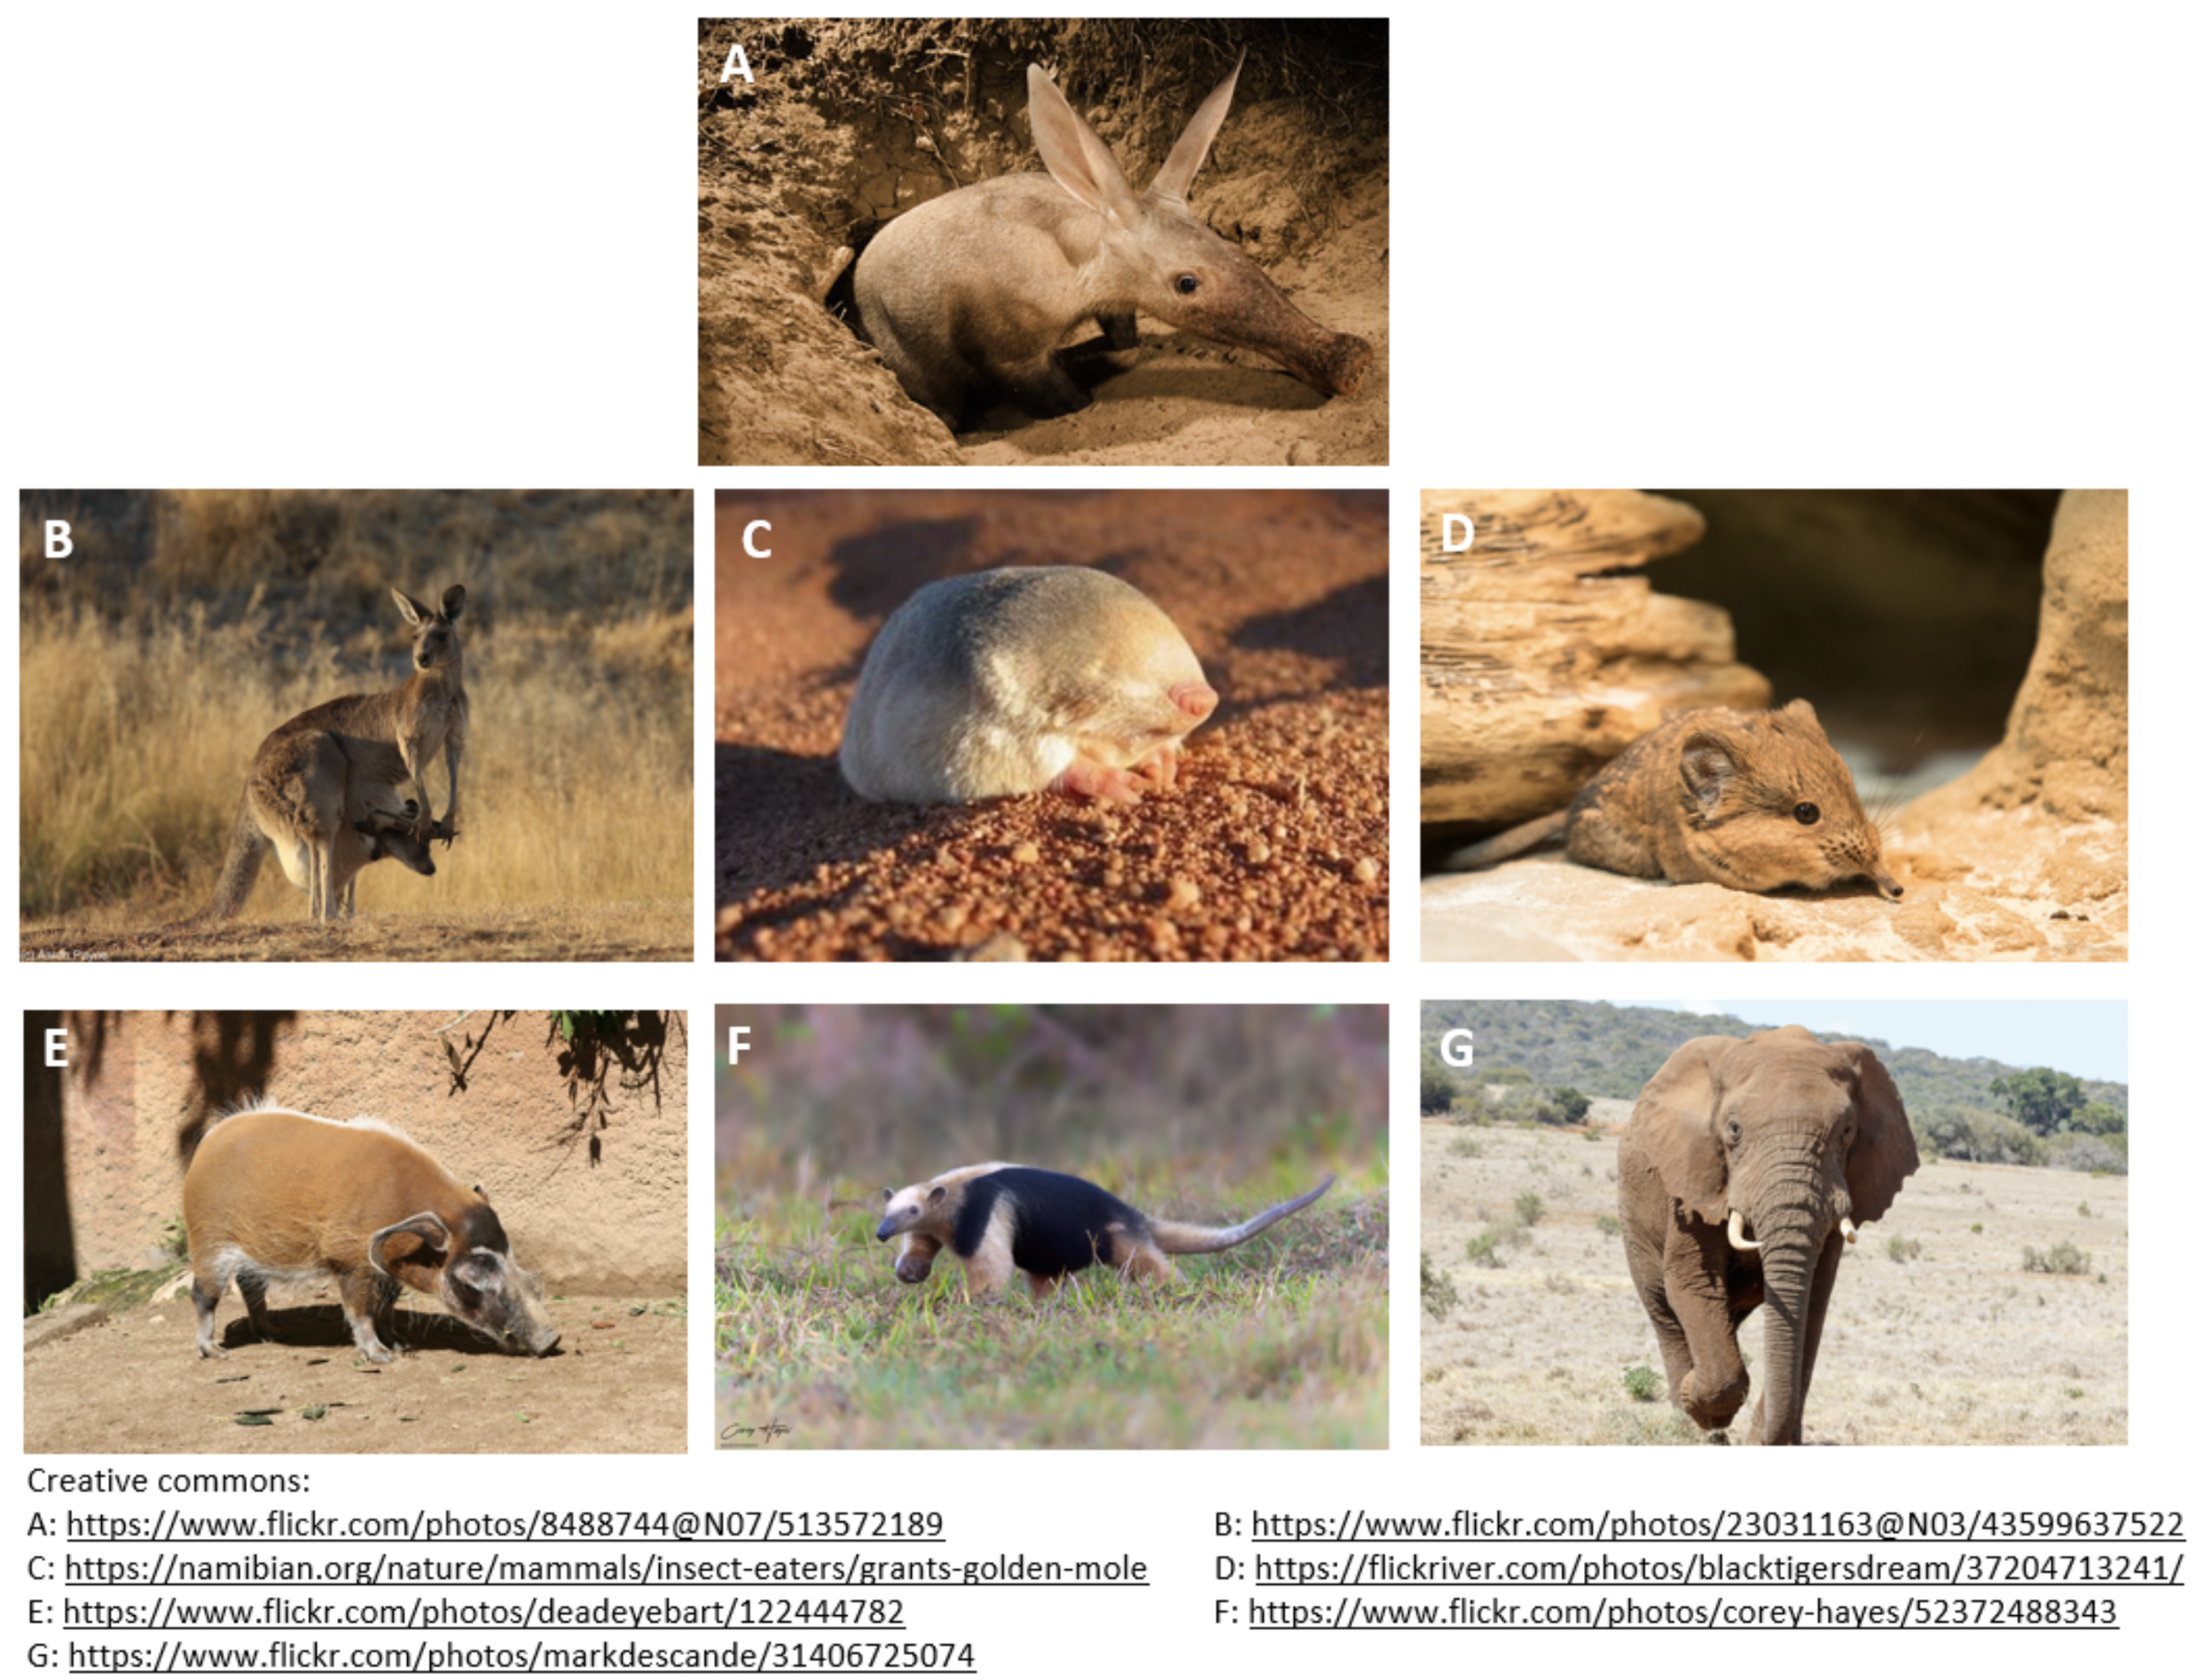
The Aardvark is a nocturnal mammal found in Africa, with the size of a big rottweiler. The long ears and face shape (not considering the nose) make you wonder if it is the long-lost cousin of the kangaroo. It mainly feeds on ants and termites, which might change your mind in regards to its heritage. It could be a type of anteater. Looking at the nose and considering that in Afrikaans, ‘erdvark’ means ‘earth pig’ or ‘ground pig,’ you might change your mind once again and consider it a type of pig. The Aardvark is truly a mystery. So, let’s solve the mystery of the Aardvark’s evolutionary relation to these reference animals! Feel free to look up cute pictures of these animals while you work on the exercises. I have collected a list of animals that I think of when I look at the Aardvark. Have the animals in Figure 32.2 in mind when you do the exercises.

To uncover the mystery of the Aardvark and its relation to the reference animals, we will be looking at the evolutionary distance between the animals listed above and the Aardvark. To do so, we need to align sequences from each of the animals. Not any gene will do. We need a highly conserved gene found in all animals, that can represent to long evolutionary distances in question.
I suggest the COI (cytochrome c oxidase I) gene (also known as the COX1 gene). The COI gene is one of the most popular phylogenetic markers for evaluating evolutionary relationships. It is found in nearly all aerobic eukaryotes, where it encodes Cytochrome C Oxidase subunit 1, a protein involved in mitochondrial respiration.
COI is a part of the mitochondrial DNA, which has the added benefit that the gene is inherited from the mother and that it does not undergo recombination. Recombination would make different parts of the aligned sequences follow seperate paths through the generations. Each segment of the alignment would then have its own tree, and we would end up modeling an avarage of many trees with a model that assumes a single tree for the entire sequence. This is obviously not good, but think about how it might bias the resulting phylogeny.
We are not the first to think this specific gene would be neat to use for phylogeny. COI has been used for DNA barcoding, which is a method for identifying and classifying species based on their genetics. This also means that this gene has been sequenced for a lot of species, making our job more manageable. It means that we do not need to fly off to some jungle, catch animals, extract DNA, create primers for the COI gene, and sequence each one. We simply look them up in the online database.
Before you go on, sit back and appreciate amazing all this is. Not only is this magnificent beast encoded by strings of only four different nucleic acids that we are able to extract becuse they are carried by all its cells. We can also identify the sequence of these nucleic acids and we can use models their evolution to place the Ardvark in the tree of life among the other species.
Build a FASTA file
To investigate the mystery of the Aardvark, you need to collect the sequences of the COI genes of all the reference animals in a way that makes it possible to compare all the gene sequences. A common way to do so is to use FASTA files. FASTA is a file format used for sequences of nucleotides or amino acids that is used by almost all bioinformatic software tools. A FASTA file can contain multiple sequences as long as they are formatted as follows: First, a line starting with “>” followed by an ID and a description of the sequence. This is known as the “header” and is one line only The following lines are the sequence. This can take up as many lines as needed. The sequence is usually split across lines with 60-80 characters on each line. The example below has 70 characters per line. To start a new sequence in the file, simply add a new header, followed by a sequence. Like this:
> ID1 some kind of description
ATGTCTTCTATTAACAGCTCTGAATCGCTTGCTGCTTCGGGAGGAAAGCCTTCTGTTTCCCACGAGTCCT
TGCCCTATAAAACTGTCACCTACTCCGGAGAAGGCAATGAGTATGTAATTATTGACAACAAAAAATACTT
GAGGCACGAGTTGATGGCTGCCTTCGGTGGTACCTTCAATCCTGGTTTGGCACC
> ID2 some other kind of description
ATGTCTTCTATTAACAGCTCTGAATCGCTTGCTGCTTCGGGAGGAAAGCCTTCTGTTTCCCACGAGTCCT
TGCCCTATAAAACTGTCACCTACTCCGGAGAAGGCAATGAGTATGTAATTATTGACAACAAAAAATACTT
GAGGCACGAGTTGATGGCTGCCTTCGGTGGTACCTTCAATCCTGGTTTGGCACCCTTTCCTAAGCATCAG
TTTGGTAACGCTTCTGCCCTAGGTATAGCAGCATTCGCCTTACCGCTTTTAGTGTTGGGCTTGTATAATT
TGCAAGCCAAAGACATTACAATTCCAAATATGATTGTTGGTTTATGTTTCTTCTACGGTGGTCTTTGTCA
ATTCTTATCTGGACTCTGGGAAATGGTCATGGGAAACACCTTTGCTGCCACTTCCT
Exercise 32-1
Now it is your turn! Make a FASTA file containing the nucleotide sequence of the COI (COX1) gene of all the reference animals and the Aardvark. Use the file “animals.fasta” to insert the nucleotide sequences. You can find the nucleotide sequences in the NCBI Nucleotide database. To search for genes, select “Gene” instead of nucleotide from the drop-down menu. If you where looking for the PRDM9 gene in humans you would, you search like this:
PRDM9[Gene Name] AND Homo sapiens[Orgn]The [Gene Name] and [Orgn] tags tells the database that “PRDM9” should be interpreted as a gene name, and “Homo sapiens” as an organism. This greatly limits your search and excludes database entries where the same words appear in other contexts. Have a quick look at the complete list of search terms available.
You are looking for COX1 and Orycteropus afer is the Latin name for Aardvark. This guides you to the page containing the database information for the COI gene for the specific organism (animal). You can find the gene sequence in a fasta format in the section “NCBI Reference Sequences (RefSeq).” Copy the gene sequence and paste it into the animals.fasta file under the appropriate header. To help you along, here are the Latin names of the animals:
| Species | Latin name |
|---|---|
| Aardvark | Orycteropus afer |
| Grey Kangaroo | Macropus giganteus |
| Golden Mole | Eremitalpa granti |
| Elephant Shrew | Macroscelides flavicaudatus |
| Red River Hog | Potamochoerus porcus |
| Collared anteater | Tamandua tetradactyla |
| African Elephant | Loxodonta africana |
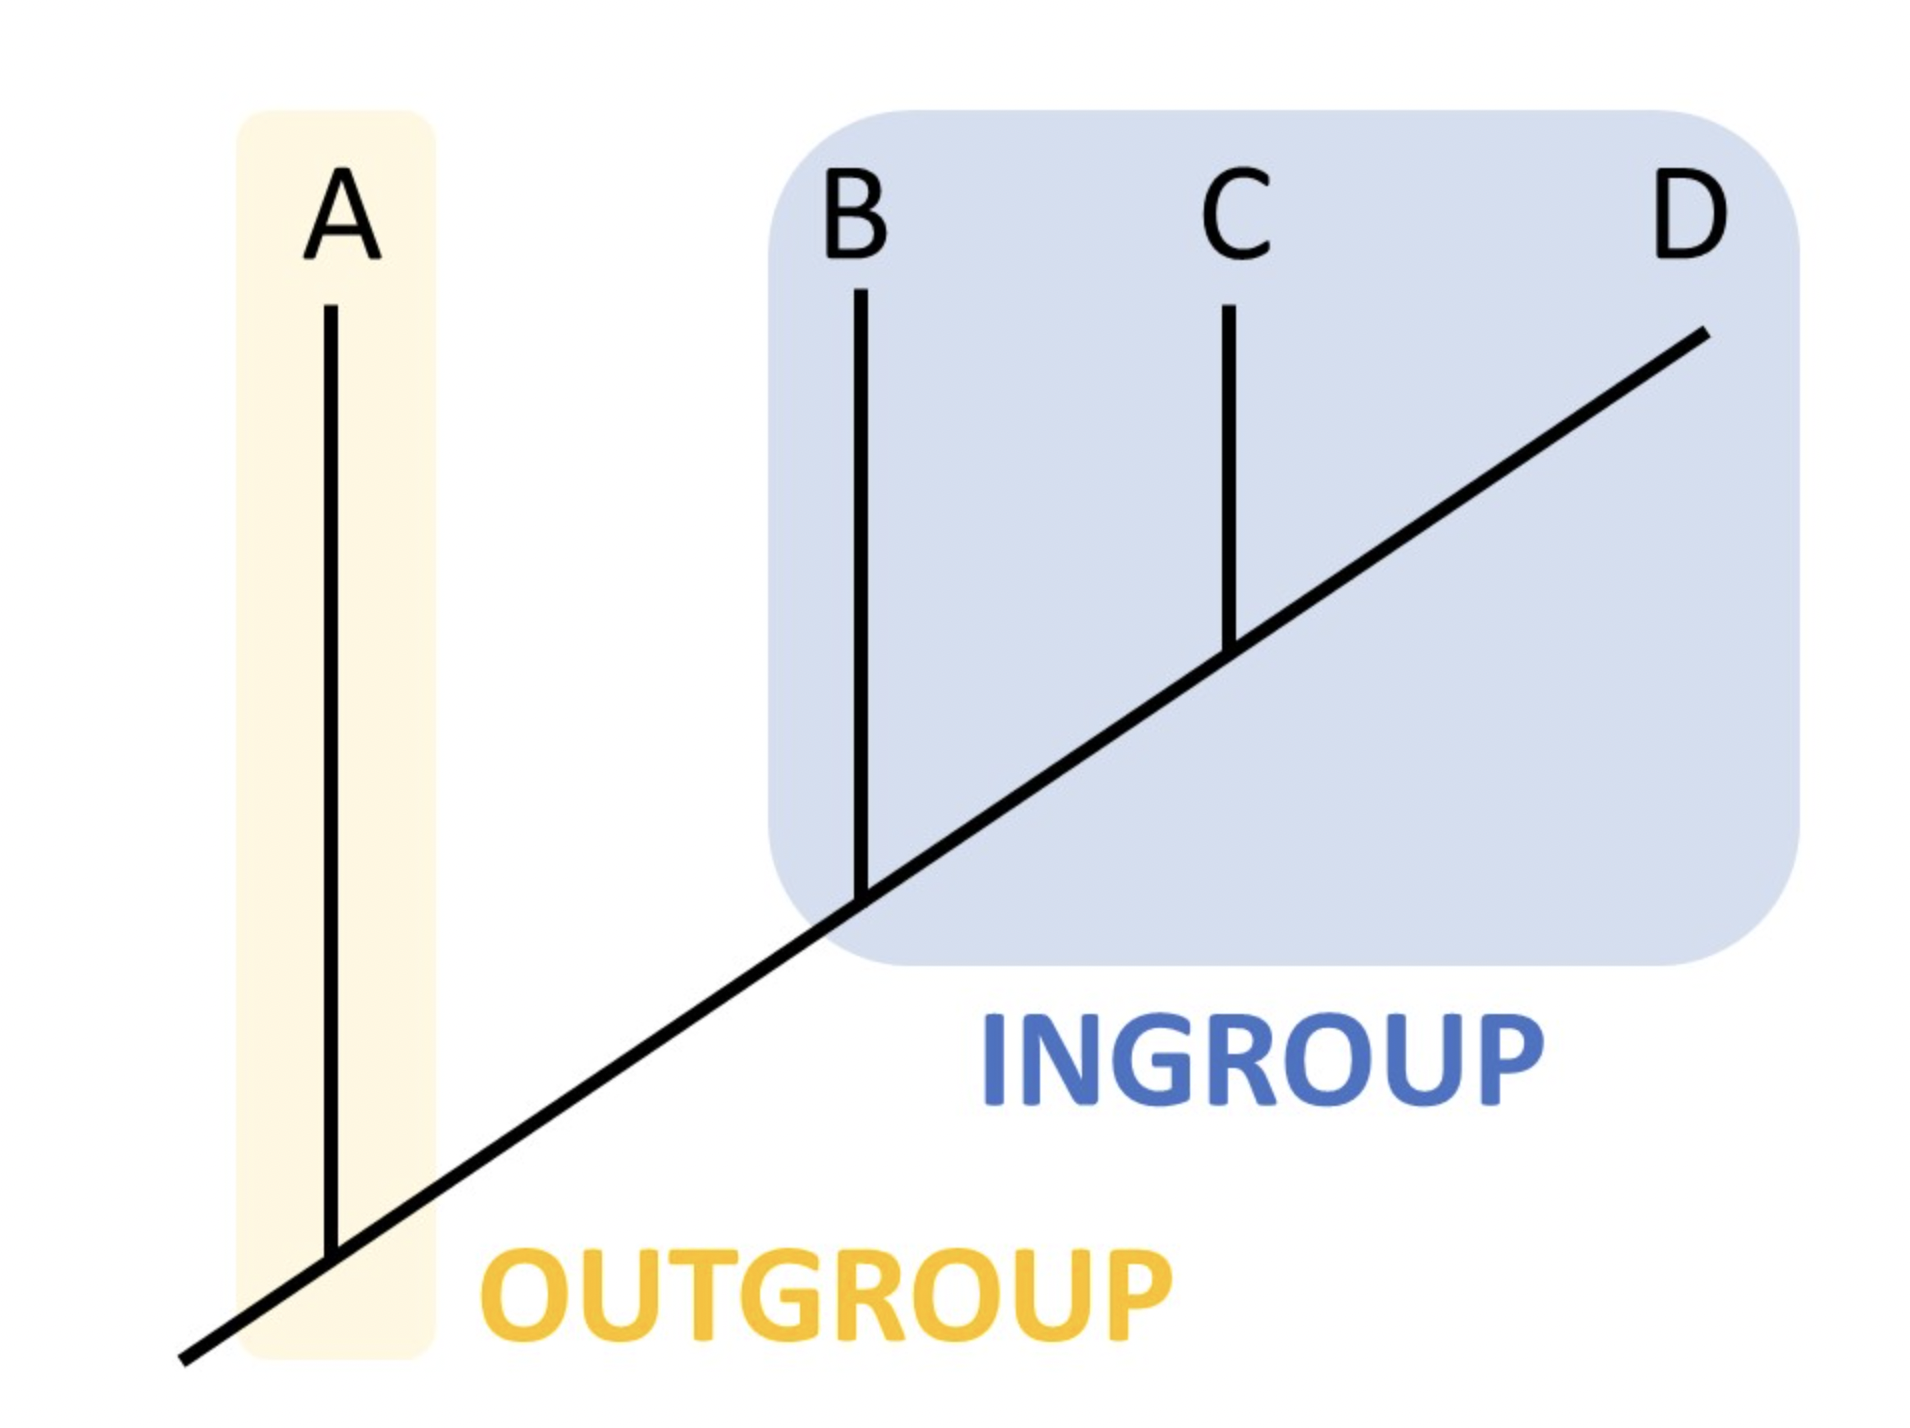
We would like to find an animal that can serve as “outgroup” in our analysis. An outgroup is a sequence so distantly related animal to all your other sequences (your “ingroup”) that you can safely assume that all your ingroup sequences find a common ancestor before before they find one with the outgroup sequence (Figure 32.3). The point where the outgroup attaches to the ingroup tree must then be the common ancestor of your ingroup sequences. Since all your subject animals are all live-bearing mammals, you can use the platypus (a monotreme)(Ornithorhynchus anatinus) as the outgroup and add it to your fasta-file.

One-click analysis
Now that you have created a FASTA file with the COI (COX1) gene of the Aardvark and all the reference animals, it is time to look into the evolutionary distances between them. We will be using the web tool www.phylogeny.fr for this exercise. When you do your phylogenetic analyses below, you need to screengrab/save your phylogenetic trees along the way. You should paste them into a document with notes on which models and parameters used for each tree. That way you can compare them all at the end.
Exercise 32-2
Go to www.phylogeny.fr and get aquianted with the web interface. Then navigate to the “one-click” analysis under the “phylogeny analysis” tab. The “one-click” analysis runs an easy initial analysis of your sequences, automating the four steps below with default models and parameters:
- Multiple sequences alignment of all the genes in your newly made FASTA file.
- Curation of the aligned sequences in order to eliminate poorly aligned positions (such as trailing nucleotides in cases where one sequence is much longer than the others).
- Building of the phylogenetic tree according to evolutionary distances calculated from the curated multiple sequence alignment.
- Visualization of the tree.
Exercise 32-3
Now that you have navigated to the “one-click” analysis page, you can upload the FASTA file you created in the previous task. Then click submit. The result is a phylogenetic tree describing the evolutionary distances between COI genes of the different animals. Take a good look at it. Does it look anything like what you expected?
Exercise 32-4
If you want to make the tree easier to interpret or to highlight specific relations, you can change the visualization without changing the information in the tree. One way is to reroot the tree. Let’s try it out. First, click on the “Reroot (outgroup)” button below the tree under the section “Select an action and click leaf or internal branch.” Then click on the name “Platypus” and wait for the tree to re-render. Now, look at it again. You can also manipulate the visualization of the tree by, instead of clicking “reroot,” you can click on “Flip” or “Swap.”
- What does Flip do?
- What does Swap do?
- What does Reroot do?
Exercise 32-5
You have played around with the tree a bit, and now you are ready address what it tells you. Start by clicking on “Reset (cancel all changes)” in the section “Select an action” and follow up by rerooting the tree with Platypus as the outgroup. Now answer the following questions:
- How much does re-rooting change the tree?
- How many terminal nodes (leaves) and how many internal nodes are there in the tree?
- Which node represents the most recent common ancestor between the Aardvark and the African Elephant? Which one is the common ancestor between the Aardvark and the Elephant Shrew? Does this hold no matter whether you forced the platypus as the outgroup?
- Which of the reference animals are closest related to the Aardvark according to this model? Does the tree look like you expected?
Different 32-6
Exercise 32-7
The “one-click” analysis uses the HKY85 substitution model to calculate the phylogenetic distances, but you can choose other models as well. Here is a rundown of the most important ones:
The Jukes-Cantor model is one of the simplest nucleotide substitution models. It assumes that all types of nucleotide substitutions (transitions and transversions) occur at an equal rate, meaning that there’s a single rate parameter for all types of substitutions. This is a highly simplified model and is often used as a baseline for comparison with more complex models.
The Kimura two-parameter model is a simple model that takes into account two types of substitutions: transitions (purine-to-purine or pyrimidine-to-pyrimidine changes) and transversions (purine-to-pyrimidine or vice versa). It assumes that transitions occur at a different rate (\(\alpha\)) than transversions (\(\beta\)), reflecting the fact that transitions are often more common in DNA evolution.
The HKY85 model is a relatively simple model that takes into account two major factors in the evolution of nucleotide sequences: transitions (purine-to-purine or pyrimidine-to-pyrimidine changes) and transversions (purine-to-pyrimidine or vice versa). It assumes that transitions and transversions occur at different rates, which makes it more biologically realistic compared to some simpler models like the Jukes-Cantor model.
The GTR model is a more complex and flexible model compared to HKY85. It allows for different substitution rates between all possible pairs of nucleotides, making it a highly general model. This means that it can accommodate variations in the substitution rates of all six possible types of nucleotide changes (A\(\leftrightarrow\)C, A\(\leftrightarrow\)G, A\(\leftrightarrow\)T, C\(\leftrightarrow\)G, C\(\leftrightarrow\)T, G\(\leftrightarrow\)T).
The Hamming distance is not a traditional substitution model used for phylogenetics. It is a simple method for comparing sequences of equal length, where it counts the number of positions at which two sequences differ (i.e., the number of substitutions needed to convert one sequence into another). It does not consider the specific types of substitutions (transitions or transversions).
What might be the reason for not alway choosing the model with the largest number of parameters?
Exercise 32-8
Let’s explore how the evolutionary distances change when you use other models and also how the different tree construction methods make a difference. You can du this by running the steps from the “one-step” analysis, but change the model of DNA evolution to explore how this affects your results.
You will start at step 1: Multiple sequence alignment. You need a multiple alignments of all your sequences. Lucky for you, www.phylogeny.fr has already done that in order to make the tree. Here, the MUSCLE program has been used (MUSCLE is conceptually close to ClustalW). We will not change the alignment method. To access the multiple alignments, click on the tab “3. Alignment”. To see the curated that, click on the tab “4. Curation”. In this tab, the alignment has been curated by the program Gblocks. Gblocks has identified the portions of the alignment suitable for distance calculation and tree-building and has underlined these portions with a dark blue box. You can read more about Gblocks in the Gblocks documentation. Go read the introduction in the Gblocks documentation. What kind of positions are excluded after curation?
Download the curated alignment by clicking on “Cured alignment in Phylip format” under the Outputs section. This gives you the equal-length aligned sequences resulting from curation by Gblocks in a phy-file. Go read the introduction in the Gblocks documentation. What kind of positions are NOT included after curation?
Exercise 32-9
Now you can see what happens if we use the same alignment same curation, but different evolutionary models to calculate the evolutionary distances. To help you calculate the evolutionary distances, www.phylogeny.fr has some nice options for calculating distance matrices for you. Let’s start by building phylogenetic trees using PhyML.
PhyML (Phylogenetic Maximum Likelihood) employs a statistical approach (maximum likelihood) to estimate the most likely tree given the input alignment. To Use PhyML, navigate to the top, tap “Online Programmes,” and choose PhyML. Here you can upload your curated alignment in phylip format (the one you downloaded from the curation tab).
PhyML now lets you choose a substitution model. A substitution model is a mathematical model that describes how genetic sequences change over time. So now you will see how these different models actually affect your tree. Try the two DNA/RNA substitution models for PhyML (HKY58 and GTR). Remember to save your tree by clicking “Tree in newick format” and save the file. These tree files can be visualised by using the program “TreeDyn” under the top tab “Online Programmes”. Do the trees formed by GTR and HKY85 look alike? What are the Aardvark’s closest relatives according to the two trees?
Explore phylogeny - part 3
Not only can you change the substitution model used in calculating the evolutionary distances. You can also use different tree-builders. You just tried PhyML, which uses a maximum likelihood approach. Next, try to use BioNJ. BioNJ stands for “Biased Neighbor Joining,” which is an adaptation of the neighbor-joining algorithm (not currently a part of www.phylogeny.fr). Neighbour Joining is a distance-based tree-building method, and BioNJ uses the same approach, with a slight bias, to avoid errors with particularly long branches. Try the three DNA/RNA substitution models for BioNJ (kimura, jukes-cantor, hamming ). Remember to save your trees. Do these three trees look alike? Do they look like the trees formed by PhyML? What are the Aardvark’s closest relatives according to the three trees?
Food for thought
Okay, step back from the Aardvark for a moment. What about the other animals we are looking at? Are their relations always the same? Are some always grouped together while others are always grouped far apart? If you are particularly curious, try to add other types of elephants to the FASTA-file and see how other types of elephants group when doing phylogeny.
Now, you have looked at the Aardvark and its evolutionary relations with other animals. You have tried many different ways. Are you more confident in your knowledge about the Aardvark, or are you feeling more confused than ever? What of the animals in your analysis is the closest relative of the Aardvark? Does Wikipedia agree with you? (https://en.wikipedia.org/wiki/Aardvark) (Read from the Introduction, Name, and Taxonomy). Do you trust Wikipedia? See if you can find the Aardvark ( Orycteropus afer) in NCBI’s Taxnomy Browser. What does that report its taxonomy?
Project files
Download the files you need for this project:
https://munch-group.org/bioinformatics/supplementary/project_files